conversationalphrase
Recycles dryer sheets
- Joined
- Jan 8, 2017
- Messages
- 264
I've been off work for the holidays, the weather has mostly been bad, so I've been playing with spreadsheets! Here's what I did:
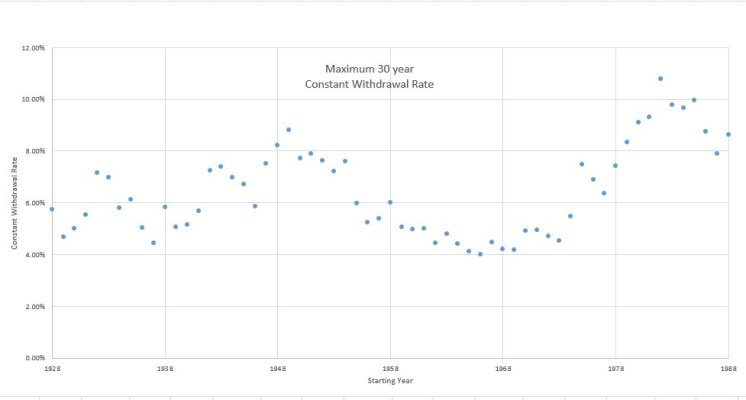
Using historical returns for S&P 500, 1 yr T-Bill, 10 yr Bonds, and annual inflation rates I calculated the maximum inflation adjusted withdrawal rate that would result in zero remaining savings after 30 years, starting each year between 1928 and 1988. These are sequential calculations for each 30 year period, they are not randomly picked historical returns and inflation rates.
I used an asset allocation of 60% stocks, 10% T-Bills, and 30% Bonds.
The results are shown in the attached plot.
Some Statistics:
I'm interested in your thoughts and observations. Has anyone seen a similar analysis elsewhere?
Using historical returns for S&P 500, 1 yr T-Bill, 10 yr Bonds, and annual inflation rates I calculated the maximum inflation adjusted withdrawal rate that would result in zero remaining savings after 30 years, starting each year between 1928 and 1988. These are sequential calculations for each 30 year period, they are not randomly picked historical returns and inflation rates.
I used an asset allocation of 60% stocks, 10% T-Bills, and 30% Bonds.
The results are shown in the attached plot.
Some Statistics:
- The minimum successful withdrawal rate was exactly 4% (1966)
- The average successful withdrawal rate was 6.4% with a standard deviation of 1.7%
I'm interested in your thoughts and observations. Has anyone seen a similar analysis elsewhere?
")
