A long term DJIA growth rate thought experiment?

BarbWire

Recycles dryer sheets
Joined
Jan 20, 2010
Messages
442
I was trying to put the current DJIA/market level into context, and thus played with a "thought experiment." I'd like y'all to check my math and logic:

"On Nov 15, 2016 the DJIA was at 18,858. On March 13, 2020 (40 months later) it was 23,185. What continuously compounded annual growth rate does this represent?"

In other words, if the DJIA had simply been growing at a steady-Eddy rate for the 40 months, rather that the huge run-up and then precipitous fall, what would that steady rate be?

For continuous compounding, using t=month and r=monthly growth rate, so 12*r = R, annual growth rate,
P(2) = P(1) exp (r*40) and R=12*r
I calculated that growth from 18,858 to 23,185 over 40 months implies an annual continuous growth rate of R= 6.2%.

So, if I've got that right, then it seems to me that even at Friday's level after sharp drops, I should still be feeling pretty good.

Yes? No?

Alas, when I plug in Monday's close at 20,841 that corresponds to an annual growth rate of 3.0%.
 
Last edited:
=EXP(LN(23185/18858)/(40/12))-1 = 6.39%
=EXP(LN(20841/18858)/(40/12))-1 = 3.04%


To me, it looks like your calculations are close to correct. Monday's fall hurt a lot, but I try not to focus on daily and short term variations.
 
Thanks for checking my calcs. Close enough for gummint work!

When this all settles down -- when we are no longer having the wild swings -- and have a new baseline, my inclination will be to look at a calculation like this and think "steady growth at "r" would have gotten me here" rather than "arrrrgh! I lost y% since the peak."

And, because I am whiling away time a the computer, maybe I'll try the calc for a few other indices. Fun, eh?
 
Last edited:
Or for the longer view (a better perspective IMO):
  • From 10 years ago to a month ago 2/18/2020 = 10.59%
  • From 10 years ago to today = 7.17%
 
Last edited:
Good job! My Adult-Ed investing class is titled "Investing for the Long Term" and I emphasize 10+ years, though I will admit 5+ from time to time. Anything less is not investing, IMO, but some degree of speculation.

Buffett: "Our favorite holding period is forever."
 
We have had so many threads in the past discussing the late Bogle's prognosis for the market. His story never changed much over the years.

On Oct 2018, he said something like 5.5 to 7% return nominal, and we have to subtract out inflation to get real return.

People did not believe him. Nah. They were so used to double-digit returns. Gotta be 15 to 20%.

If Bogle turns out to be right, I will live very fine on that measly return. And if he is wrong, will I complain?
 
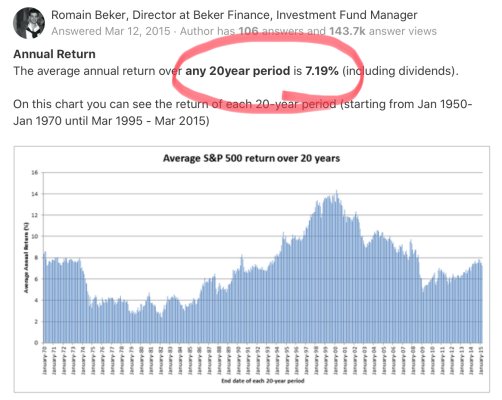
For the S&P 500, the 20 year return with dividends reinvested is in the 4.6% range. The real return is only 2.3%.

Not that great when you include the lost decade in the picture.
 
For the S&P 500, the 20 year return with dividends reinvested is in the 4.6% range. The real return is only 2.3%.

Not that great when you include the lost decade in the picture.
:confused:
 

Attachments

  • AF7825B9-F54C-4497-99C5-DFFA00976711.jpeg
    AF7825B9-F54C-4497-99C5-DFFA00976711.jpeg
    452.5 KB · Views: 17
Last edited:
I started with 11/2016 because I was interested in the behavior during the current administration, and the especially steep run-up.

40 months is, of course, way to short for serious investing; heck, I'm still sitting on "cash" from a house sale in 2016 because I did not know for sure whether I would buy another house or not within the next three - five years.

I've also run the numbers for several indices starting when I ER'd in 2013. Again, not trying to say they reflect long-run performance, but just trying to see a bigger picture obscured by recent wild market volatility.

Hardly a hardcore scientific analysis. Just a matter of curiosity. And a bit of fun.


Do your calculations include dividends? That would bump it up if you didn’t.
 
Do your calculations include dividends? That would bump it up if you didn’t.


Nope. This was just a back-of-the-envelope exercise, for fun, and I put it here because I wanted someone to check my calculations, which N02L84ER kindly did with a slightly different formulation.
 
Originally Posted by tdv2 View Post
For the S&P 500, the 20 year return with dividends reinvested is in the 4.6% range. The real return is only 2.3%.

Not that great when you include the lost decade in the picture.
:confused:

He said "the 20 year return", not "any 20 year return", which is what the graphic you provided shows.


-ERD50
 
Back
Top Bottom