Allocation vs withdrawal rates

rafapark

Dryer sheet wannabe
Joined
Mar 17, 2011
Messages
19
Location
Greenville
I plan to retire in 2016 and throughout the past years I've been moving my investments to match where I want to eventually be in terms of allocation. My approach is similar to most people: take the necessary risk to match my expected return but no more. This is where I have my question. Basically, I'd like to understand how others are calculating this. For example, say I want to withdraw 2% a year. So I am estimating that a 30% Stock, 70% fixed should get me the average return to meet that requirement and keep up with inflation with the lowest possible risk. How are others approaching this? I am trying to develop a table that would look like this ( just examples):

if Withdrawal
2%
Then Allocation
30% equities/70% fixed
if Withdrawal
3%
Then Allocation
40% equities/60% fixed
if Withdrawal
4%
Then Allocation
45% equities/65% fixed

and so on.

Or another way to put this is, instead of withdrawal %, I could include expected return. I am just guessing the allocations above. I wonder is there is a better way to do this. Maybe a formula that will give me the recommended allocation to the expected withdrawal or expected average return throughout the years.

Thanks for the input
 
FireCALC has an 'investigate' tab, enter your specifics and then set it to investigate different AA's.

I expect you will find that 30/70 isn't a good match for a 30+ year horizon, regardless of the withdraw rate. Something in the 50/50 to 80/20 will have performed better throughout history.

-ERD50
 
Vanguard figures that a 70/30 stock/bond portfolio can generate 4% on top of inflation, i.e. no draw down of capital.
 
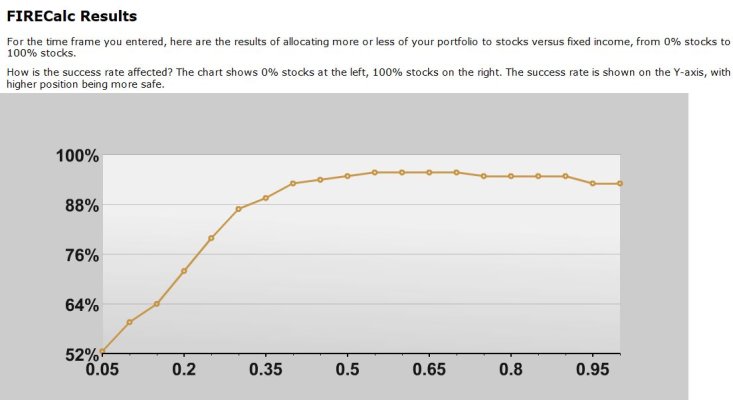
Here ya go - from FIRECalc. Indicates you need 40% or more equities in your AA to maximize 30 year survivability:
 

Attachments

  • Equity % success rates.JPG
    Equity % success rates.JPG
    65.2 KB · Views: 64
Vanguard figures that a 70/30 stock/bond portfolio can generate 4% on top of inflation, i.e. no draw down of capital.

That doesn't sound right. A 4% WR will draw down capital in many historical paths.

Reference, link?

-ERD50
 
Vanguard figures that a 70/30 stock/bond portfolio can generate 4% on top of inflation, i.e. no draw down of capital.


4% on top of inflation, long term, not every single year


any stochastic analysis will show that fund having at least one trial return under inflation every year in the projection period
 
Last edited:

yes and the fund went down yesterday.

"The Managed Payout Fund targets an annual distribution rate of 4%. To accomplish this, the fund’s portfolio managers aim to adjust the fund’s overall asset allocation over time with an emphasis on sustaining its monthly payouts, keeping pace with inflation, and preserving capital over the long term."

it's a goal, not a certainty - looks like a good fund though!
 
In the past, I've seen similar graphs which typically show the "sweet spot" some where around 35 to 40% stocks vs bonds. The BIG difference is the potential for the surviving (after 30 years) portfolio amount. Most 30 year runs lead to much larger remainders for those who have more stock in the port. BUT, survivability doesn't seem much affected by having relatively less stock IIRC. Most here are much more astute about these things, so YMMV.
 
I've done several along those lines, using FIRECALC. Here's the last one http://www.early-retirement.org/forums/f28/asset-allocation-and-swr-history-revisited-70557.html. And an earlier variation http://www.early-retirement.org/for...rates-asset-allocation-to-equities-65054.html.

However, the OP left off duration/how many years in retirement, another of several inevitable uncertainties. It can't be simply reduced to WR vs AA (or returns).

And of course they're only good if history repeats itself, e.g. no worse than the Great Depression and other market pullbacks over the past 140+ years...
 
Last edited:
45/65 is cheating. :facepalm: ...

Sure, but here's one way of doing it. After buying 65% bond, you still have 35% left over for stock. Get 25% worth of S&P index, then put the remaining 10% into a 2x leveraged S&P ETF.

25% S&P + (10% S&P) x 2 = 45% S&P. Ta da!

Or one can buy the components of the S&P which have higher volatility.

The small problem with all the above methods is that it does not pay 2x the dividends of the S&P. What? You want that too?
 
I plan to retire in 2016 and throughout the past years I've been moving my investments to match where I want to eventually be in terms of allocation. My approach is similar to most people: take the necessary risk to match my expected return but no more. This is where I have my question. Basically, I'd like to understand how others are calculating this. For example, say I want to withdraw 2% a year. So I am estimating that a 30% Stock, 70% fixed should get me the average return to meet that requirement and keep up with inflation with the lowest possible risk. How are others approaching this? I am trying to develop a table that would look like this ( just examples):

if Withdrawal
2%
Then Allocation
30% equities/70% fixed
if Withdrawal
3%
Then Allocation
40% equities/60% fixed
if Withdrawal
4%
Then Allocation
45% equities/65% fixed

and so on.

Or another way to put this is, instead of withdrawal %, I could include expected return. I am just guessing the allocations above. I wonder is there is a better way to do this. Maybe a formula that will give me the recommended allocation to the expected withdrawal or expected average return throughout the years.

Thanks for the input
boy... you play with fonts a lot..

from your post I'm all screwed up.. 1.5% WR... 65%/35% eq/bnd... sorry, I must be doing this wrong
 
Sure, but here's one way of doing it. After buying 65% bond, you still have 35% left over for stock. Get 25% worth of S&P index, then put the remaining 10% into a 2x leveraged S&P ETF.

25% S&P + (10% S&P) x 2 = 45% S&P. Ta da!

Or one can buy the components of the S&P which have higher volatility.

The small problem with all the above methods is that it does not pay 2x the dividends of the S&P. What? You want that too?

No thanks... IIRC those leveraged funds do not have a very good record of producing returns that leverage the index.
 
True, they don't always move at the exact rate that they shoot for.

But sometimes they move more than 2x the S&P, to make up for the times they move less than 2x.

For example, if the market moves up 1%, they may move up 1.9%. But if the market goes down 1%, they may drop 2.1%. It will all average out, see?
 
Well, The SEC warns us that they don't work very well, and certainly not for the application that you proposed. See SEC.gov | SEC-FINRA Investor Alert on Leveraged and Inverse ETFs

The following two real-life examples illustrate how returns on a leveraged or inverse ETF over longer periods can differ significantly from the performance (or inverse of the performance) of their underlying index or benchmark during the same period of time.

  • Between December 1, 2008, and April 30, 2009, a particular index gained 2 percent. However, a leveraged ETF seeking to deliver twice that index's daily return fell by 6 percent—and an inverse ETF seeking to deliver twice the inverse of the index's daily return fell by 25 percent.
  • During that same period, an ETF seeking to deliver three times the daily return of a different index fell 53 percent, while the underlying index actually gained around 8 percent. An ETF seeking to deliver three times the inverse of the index's daily return declined by 90 percent over the same period.
 
It was a joke. See my post #15 above.

The tracking error of these leveraged ETFs is real, a large part due to trading costs of the derivatives to implement the leverage. They are more useful for short-term hedging or making bets on short-term market movements, and I have done so on occasions.

The above said, some of these ETFs that are based on broader indices, not a small sectoral index, have quite a reasonable record over longer periods. I am guessing that it may be due to better liquidity of the derivatives that they employ. For example, one such 3x ETF returned 6.13X for the past 5 years, while its underlying index moved 2.1X (total return). I think it's quite impressive, considering that the ETF has as high as 1% ER.

The ETF shall remain nameless, as I do not want to look like I am touting it. In fact I have not used it, but just looked at it recently out of curiosity.
 
Last edited:
Vanguard figures that a 70/30 stock/bond portfolio can generate 4% on top of inflation, i.e. no draw down of capital.

Sadly, Vanguard doesn't say that at all....... Not even close. They don't plan on maintaining a 70/30 allocation in the Managed Payout Fund and preserving capital over the long run at the original investment level or better, despite 4% real annual withdrawals, is only a goal, not a given.

They do say, on the link you provided in another post:

The Managed Payout Fund targets an annual distribution rate of 4%. To accomplish this, the fund’s portfolio managers aim to adjust the fund’s overall asset allocation over time with an emphasis on sustaining its monthly payouts, keeping pace with inflation, and preserving capital over the long term.

Vanguard's actual statement is very different than your interpretation.
 
Last edited:
That doesn't sound right. A 4% WR will draw down capital in many historical paths.

Reference, link?

-ERD50

Yes. It not only doesn't sound right. It isn't right. And I think it's important to clarify so readers aren't misled.

Vanguard does not plan to hold a 70/30 AA in the Managed Payout Fund but rather will vary
AA to support an ongoing 4% real WR while attempting to preserve capital.

Even though Vanguard does not plan to use a constant 70/30 AA, I submitted a FireCalc trial with a 70/30 AA and 30 year span just to see what would happen. I used a one million portfolio and a 40k WR. All else default. A significant number of years resulted in ending balances below the one million beginning balance. A few even went negative causing failures.

I couldn't get the output graph to copy and paste here, but it's only takes a couple minutes to set it up so have a look yourself.

If Vanguard was guaranteeing they can have all outcomes from a 70/30 portfolio result in an ending balance equal to or greater than the beginning balance (real) after 30 years of 4% inflation adjusted withdrawals, then we should all be buying into this managed fund and giving up on indexing! Historically, the original balance (real) is only maintained some of the time.

Take a look.
 
Last edited:
according to kitces , for a 60/40 mix by applying the 4% rule, over 2/3rds of the time the retiree finishes with more than double their wealth at the beginning of retirement, on top of a lifetime of (4% rule) spending! Half the time, wealth is nearly tripled by the end retirement, as retirees fail to spend their upside!
 
Last edited:
Here ya go - from FIRECalc. Indicates you need 40% or more equities in your AA to maximize 30 year survivability:

This has come up before but if I'm reading the chart correctly, it doesn't matter if it's 40% or 80%. 80% doesn't seem to get you any more than 40%

I just have a hard time wrapping my head around that.

Or is this solely demonstrating 'survivability' and not growth?
 
Exactly.

80% will almost certainly have you end up with a larger terminal balance 30 years down the road, but the ride will be much more exciting in getting there.

Thanks. I love the term "terminal balance". So............exacting.
 
Sadly, Vanguard doesn't say that at all....... Not even close. They don't plan on maintaining a 70/30 allocation in the Managed Payout Fund and preserving capital over the long run at the original investment level or better, despite 4% real annual withdrawals, is only a goal, not a given.

They do say, on the link you provided in another post:


Vanguard's actual statement is very different than your interpretation.


:peace::peace::peace:

You all sure do take things literally... From where I'm from, if someone says they "figure" or "reckon" they can do something it doesn't mean 100% guarantee that it will happen... It means that they will *try* to make it happen.

Anyway your calculations are not going to be correct. Vanguard is including 10% in a market neutral fund, and soon another 10% in a "hedge fund" of sorts. They also have 20% in low volatility and 5% in commodities.

Furthermore the AA and the constituents of the fund have shifted many times. Right now they are 5% over weight in emerging market stocks. In the past they have been over weight in reits. I've also seen the overweight in corporate bonds... You are not going to be able to use FireCalc to predict what will happen with this fund.
 
Back
Top Bottom