 |
|
 11-20-2019, 04:37 PM
|
#61
|
|
Thinks s/he gets paid by the post
Join Date: Dec 2015
Posts: 1,166
|
Retired this year at age 55..AA is roughly:
23% equities (16.47% US, 6.32% Intl)
16% Bond funds
61% CDs, MMs, etc
Dividends from the CDs, MMs and a couple of high yield equity positions we hold pay a good chunk of the bills, so we don't need to pull much (probably < 2% annually) from the stock or bond parts of the portfolio unless we need to fund a big and unplanned purchase. I prefer being able to SWAN and not worry about SOR risk by having a high allocation to CDs & (previously, before rates dropped through the floor, MMs) - especially after a 10+ year bull market that is very long in the tooth.
I expect a potentially significant drop in equities in 2020, particularly with it being an election year. Whether that materializes or not is anyone's guess, but I'd plan to increase equity positions with the 30+% drop I expect is fairly close to right around the corner - if not 2020, then 2021 or even 2022. I can forego some (likely small) incremental gains over the next year or two to have dry powder to "buy low", as I'm confident we'll see prices below the levels they're currently at within the next couple of years. I also feel a whole lot better not having big volatility in our net worth in the first years of ER..
My approach is somewhat in line with Kitces "bond tent" approach where you raise equity position once you get past the main SOR risk of ER. Except in my case, I'm using CDs at an average payout of 3%+ in lieu of individual bonds or a larger bond fund exposure..
|

|

|
 |
Join the #1 Early Retirement and Financial Independence Forum Today - It's Totally Free!
Are you planning to be financially independent as early as possible so you can live life on your own terms? Discuss successful investing strategies, asset allocation models, tax strategies and other related topics in our online forum community. Our members range from young folks just starting their journey to financial independence, military retirees and even multimillionaires. No matter where you fit in you'll find that Early-Retirement.org is a great community to join. Best of all it's totally FREE!
You are currently viewing our boards as a guest so you have limited access to our community. Please take the time to register and you will gain a lot of great new features including; the ability to participate in discussions, network with our members, see fewer ads, upload photographs, create a retirement blog, send private messages and so much, much more!
|
|
11-20-2019, 06:57 PM
|
#62
|
|
Thinks s/he gets paid by the post
Join Date: Dec 2016
Posts: 1,335
|
 Quote: Quote:
Originally Posted by SunBlueSky

Age 54, first year of retirement, no pension, asset allocation as of today:
74.4% Cash/CD/MM/Savings/Checking
16.1% Stocks/Equity
8.40% REIT's
1.10% Bond Funds
|
Wow...you must have a lot of money....that AA will provide very little growth over time
I've always been very heavy in stock and it's the reason I was able to retire at 50.
53 now.
I'm at like 90%+ equity
|

|
|
|
11-20-2019, 07:35 PM
|
#63
|
|
Give me a museum and I'll fill it. (Picasso)
Give me a forum ...
Join Date: Nov 2009
Posts: 6,697
|
I have different investment objective for my taxable versus rollover IRA accounts. Therefore, I have different AAs for each. The taxable account is more income oriented, so I have more bonds in it than I do the rollover IRA, an account I won't be able to tap into for at least another 3 years (I am 56, but have had the rollover IRA for 11 years after it was my old 401k).
I have been gradually reducing the stock portion of the Rollover IRA as I age. It began at 55/45 and it is now 45/55.
__________________
Retired in late 2008 at age 45. Cashed in company stock, bought a lot of shares in a big bond fund and am living nicely off its dividends. IRA, SS, and a pension await me at age 60 and later. No kids, no debts.
"I want my money working for me instead of me working for my money!"
|
|
|
|
|
11-20-2019, 08:02 PM
|
#64
|
|
Thinks s/he gets paid by the post
Join Date: Dec 2015
Posts: 1,166
|
There are a lot of different schools of thought on what to do once you're out of the accumulation stage and into the ER/preservation stage, and the two phases can be very different.
Some pretty learned guys like Rick Ferri and Michael Kitces among others are not only comfortable with relatively low equity allocations in ER, but actually recommend it. Ferri, for example, says the "sweet spot" for those in early or normal retirement is ~35% equities. Kitces has recommended his "bond tent" approach where you have lower equities earlier in retirement, then raise the equity exposure once you're out of the ER years with reduced SOR risk and SS or other income streams come online.
If (like me), you expect the market to drop heavily in the next year or two, there's no sense exposing yourself to lots of market risk unless you "need" to. If you have a plan that pays the bills and helps bridge you to SS that doesn't require a high allocation to equities, it can in some situations make sense to lower your risk, get to SS, THEN re-assess how much you want to "let ride" on stocks to fund later years of spending.
Or course, I could be totally wrong, and the Dow could rocket to 30K+ and keep going without ever visiting the mid 20K levels again. But I do expect a big drop in the next year or two, and it's very likely that we'll see levels on the Dow below where we are now in that time. So, why watch your portfolio drop 30-50% AGAIN, like it did in 2008 unless you absolutely need to take that level of equity risk to meet your goals? Stock valuations are at nearly all-time highs (only 2 higher Schiller PE ratios previously - and currently at basically the same level as "Black Tuesday" in 1929), the bull is one of the longest in history, and we have an election year coming up with several candidates hammering Wall Street and wealth in general pretty hard. All that together doesn't bode well IMHO for equities in 2020, current run-up aside..
|
|
|
|
|
11-20-2019, 08:10 PM
|
#65
|
|
Thinks s/he gets paid by the post
Join Date: Dec 2016
Posts: 1,335
|
Quote:
Originally Posted by 24601NoMore
There are a lot of different schools of thought on what to do once you're out of the accumulation stage and into the ER/preservation stage, and the two phases can be very different.
Some pretty learned guys like Rick Ferri and Michael Kitces among others are not only comfortable with relatively low equity allocations in ER, but actually recommend it. Ferri, for example, says the "sweet spot" for those in early or normal retirement is ~35% equities. Kitces has recommended his "bond tent" approach where you have lower equities earlier in retirement, then raise the equity exposure once you're out of the ER years with reduced SOR risk and SS or other income streams come online.
If (like me), you expect the market to drop heavily in the next year or two, there's no sense exposing yourself to lots of market risk unless you "need" to. If you have a plan that pays the bills and helps bridge you to SS that doesn't require a high allocation to equities, it can in some situations make sense to lower your risk, get to SS, THEN re-assess how much you want to "let ride" on stocks to fund later years of spending.
Or course, I could be totally wrong, and the Dow could rocket to 30K+ and keep going without ever visiting the mid 20K levels again. But I do expect a big drop in the next year or two, and it's very likely that we'll see levels on the Dow below where we are now in that time. So, why watch your portfolio drop 30-50% AGAIN, like it did in 2008 unless you absolutely need to take that level of equity risk to meet your goals? Stock valuations are at all-time highs, the bull is one of the longest in history, and we have an election year coming up. All that together doesn't bode well IMHO for equities in 2020, current run-up aside..
|
You make some interesting points. Thanks.
|
|
|
|
|
11-20-2019, 08:16 PM
|
#66
|
|
Thinks s/he gets paid by the post
Join Date: Sep 2006
Posts: 1,743
|
We are both 66. Our AA is 52/40/8 since we retired 6 years ago.
No plans to reduce our allocations to equities below 50% for the foreseeable future.
|
|
|
|
|
11-20-2019, 08:18 PM
|
#67
|
|
Thinks s/he gets paid by the post
Join Date: Dec 2015
Posts: 1,166
|
Oops - I was mistaken. Ferri actually says the "center of gravity for retirees and early retirees" is 30% equities, 70% Fixed Income. Original article is at:
https://www.forbes.com/sites/rickfer.../#ef4f4a45dae9
Of course, YMMV and realize there are a lot of different opinions and preferences on what people are comfortable with. But I do think Rick's logic is sound and the following from the article made a lot of sense (to me)..
Retirees and those almost retired shouldn’t care what their highest level of risk tolerance is because they shouldn’t be investing anywhere near it. There is no economic reason for a person to take more investment risk than necessary once they’ve accumulated enough money for retirement. The focus should be on the minimum amount of risk needed to achieve an income required in retirement.
FWIW..
|
|
|
|
|
11-20-2019, 08:39 PM
|
#68
|
|
Moderator Emeritus
Join Date: Aug 2007
Location: Northern Illinois
Posts: 16,602
|
Asset Allocation
^ Thanks for the link. I generally agree with Ferris position.
Quote:
|
Stocks are claims on future earnings and deserve a higher risk premium than bonds that pay a known interest rate and return principal at maturity. Uncertainties surrounding future earnings make stock prices much more volatile than bonds and can result in bear markets that last several years. Investors who are working and accumulating assets can weather these periods of uncertainty and benefit from a higher allocation to stocks. Thats not the case with someone living off their investments.
|
He brings up a good point in that stocks are claims on unknown future earnings whereas bonds are based on known interest and return principal. Somewhat explains the differences in volatility between the 2.
|
|
|
|
|
11-20-2019, 08:45 PM
|
#69
|
|
Thinks s/he gets paid by the post
Join Date: Dec 2016
Posts: 1,335
|
Quote:
Originally Posted by Ronstar
^ Thanks for the link. I generally agree with Ferris position.
But like we have discussed, there are a lot of factors at play here. Not just age and position in the retirement term. All personal circumstances define risk in the allocation.
|
I think there is a bit of hyperbole in the quote you referenced. Over time stocks are not "much more volatile than bonds"and obviously stocks carry more uncertainty. That's why over time they dwarf the returns bonds have provided.
Also, his comment that bear markets can "last several years" is not true. Possible? sure, but bear markets on average last about 18 months.
|
|
|
|
|
11-20-2019, 08:56 PM
|
#70
|
|
Moderator Emeritus
Join Date: Aug 2007
Location: Northern Illinois
Posts: 16,602
|
Asset Allocation
Quote:
Originally Posted by FREE866
I think there is a bit of hyperbole in the quote you referenced. Over time stocks are not "much more volatile than bonds"and obviously stocks carry more uncertainty. That's why over time they dwarf the returns bonds have provided.
|
As part of my allocation research, I checked returns since inception between Vg Total Stock and Total Bond funds. Total Stock is 6.87. total Bond is 4.26. These are average returns, so the numbers don’t really address volatility. But I was surprised that the bond fund return was that close to the stock fund return.
Quote:
|
Also, his comment that bear markets can "last several years" is not true. Possible? sure, but bear markets on average last about 18 months.
|
I agree - his comment on bear market longevity was a little extreme - just to support his position I suppose.
|
|
|
|
|
11-20-2019, 09:02 PM
|
#71
|
|
Thinks s/he gets paid by the post
Join Date: Dec 2016
Posts: 1,335
|
[QUOTE=Ronstar;2327934]
Quote:
Originally Posted by FREE866
I think there is a bit of hyperbole in the quote you referenced. Over time stocks are not "much more volatile than bonds"and obviously stocks carry more uncertainty. That's why over time they dwarf the returns bonds have provided.[ /QUOTE]
As part of my allocation research, I checked returns since inception between Vg Total Stock and Total Bond funds. Total Stock is 6.87. total Bond is 4.26. These are average returns, so the numbers dont really address volatility. But I was surprised that the bond fund return was that close to the stock fund return.
|
That seems about right. Over a 10 year time frame a million dollars in stocks at 6.87% gives you almost 2 million . At 4.26 you have about 1.5 million. 2X the return.
|
|
|
|
|
11-20-2019, 09:08 PM
|
#72
|
|
Give me a museum and I'll fill it. (Picasso)
Give me a forum ...
Join Date: Mar 2016
Posts: 8,968
|
Age 64 - 78/19/3
|
|
|
|
|
11-20-2019, 09:11 PM
|
#73
|
|
Dryer sheet aficionado
Join Date: Jan 2019
Posts: 34
|
This is more detail than you asked for but since I have one of the higher equity allocations in this thread I thought Id explain my strategy. Left megacorp in February and Im turning 55 in December. 95% equity, 5% Muni bonds (yielding 4.5%).
Im a Dividend Growth Investor holding 55 growth, value, and defensive stocks, mostly large caps. I will consolidate my holdings to approx 40 companies this coming year pending our tax situation.
These companies are mostly dividend champions or contenders and they raise their dividends each year. For example, MSFT (17 years of dividend increases) and in the case of JNJ or KO (56 yrs), PG and GPC (62 yrs). I really like this strategy in good years like this year (up around 25% including dividends) and pull backs like last December where I was flat for the year but still received the dividends because I always have cash from dividends to pay the bills and care less about the account value since these companies will be around long after Im gone.
Our annual dividend yield is 3.2% and the dividend income is growing at 8% per year. I never got annual raises like that from megacorp! We have an expensive standard of living and the dividend income mostly covers our costs without having to liquidate much. I try to avoid eating the seed corn and Im extremely motivated not to so I dont have to go back to w*rk.
The best news is when the recession hits we can easily scale back about 30% of our current spend (country club, eating out all the time, major trips, etc) and reinvest the additional dividend income into whatever is beaten down at the moment. Im using FASTGraphs to manage this portfolio and would be flying blind without it as it helps me identify under/over valued stocks. GLTA!
|
|
|
|
|
11-20-2019, 09:59 PM
|
#74
|
|
Recycles dryer sheets
Join Date: Aug 2016
Location: Austin
Posts: 182
|
53 years old
Currently 65/30/5 but building up cash position. Will hold at 60/30/10 in my 60s, then probably drift toward 50/30/20 in my 70s. I dont think Ill ever hold less than 45% equitiesbut that could change.
I have a decent sized pension that allows me to stay more aggressively invested than I might otherwise for my age. But Ive never used my age to set AAjust more about my risk tolerance than anything.
Ive noticed a considerable reduction in volatility since going 65/30/5 from 75/20/5 and I am more comfortable now than ever in terms of market risk
|
|
|
|
|
11-21-2019, 05:25 AM
|
#75
|
|
Thinks s/he gets paid by the post
Join Date: Dec 2015
Posts: 1,166
|
Quote:
Originally Posted by FREE866
I think there is a bit of hyperbole in the quote you referenced. Over time stocks are not "much more volatile than bonds"and obviously stocks carry more uncertainty. That's why over time they dwarf the returns bonds have provided.
Also, his comment that bear markets can "last several years" is not true. Possible? sure, but bear markets on average last about 18 months.
|
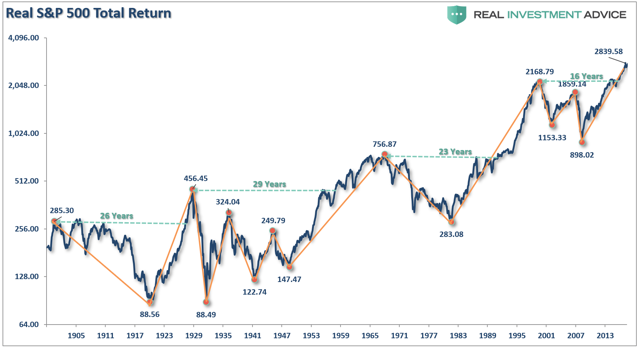
If anyone hasn't already seen this chart, it nets out the risk any of us are taking with equities.
There have been periods where equities have been down from peak for as many as 29 YEARS. So, it might be good to not only think about how long a bear market lasts, but more importantly - how long will it take for the equity part of your portfolio to recover from a market drop?
Not sure about any of you, but as someone in very early (year one) ER, I don't want to go through a period of time when my net worth is significantly less than it is now because we're in a 29, 26, 23 or even 16 year "recovery from peak" period. No thanks. I'll play it conservative for now, wait for the next (inevitable as we are overvalued at this point, IMHO) big drop, buy low and ride the next leg up. In the meantime, those of us with lower equity positions are relatively protected from the next potential 20+ year trough in equity prices and more importantly - 20+ year periods where the equity value of our portfolio is potentially much less than it was at the peak.
The thing I liked most about the article from Rick Ferri that I posted is his recommendation that those of us in retirement not invest according to our perceived ability to take risk, but only to the minimum level needed to generate the income needed. That's IMHO a very good recommendation and sure helps with SWAN..unless, of course, you're personally comfortable with potentially being "underwater" after the next market drop for 20 years or more.
|
|
|
|
|
11-21-2019, 09:11 AM
|
#76
|
|
Give me a museum and I'll fill it. (Picasso)
Give me a forum ...
Join Date: Mar 2017
Location: City
Posts: 10,351
|
Quote:
Originally Posted by 24601NoMore
If anyone hasn't already seen this chart, it nets out the risk any of us are taking with equities. ...
|
I don't have any idea what this sentence is trying to communicate. I also don't understand the chart. I tried to find it at https://realinvestmentadvice.com/ but could not.
First, it is titled " ... Total Return." Return is conventionally expressed in dollars or as a percentage. The chart does neither.
Second, it appears to be trying to make some point about where the S&P 500 has been since around 1900. Wikipedia, however, tells me that the index was created in 1957.
Third, if it is trying to make some point related to the nominal value of the index this is fallacious because total return, including dividends, is the name of the investing game.
Fourth, the whole site is a hustle. For example, they trumpet being in Financial Times list of top advisors. The fine print defines selection criteria: " Applicants were then graded on six factors: assets under management (AUM); AUM growth rate; years in existence; advanced industry credentials of the firms advisers; online accessibility; and compliance records." IOW, how good is the firm at selling? Nothing about performance.
@24601NoMore, I'd appreciate a link to the chart and its explanation. I am actually quite curious.
Quote:
Originally Posted by 24601NoMore
... I don't want to go through a period of time when my net worth is significantly less than it is now ...
|
Nobody does. Probably nobody wants to go to the dentist either. But both are good for you in the long term.
Here is a chart I use with my "Investing for the Long Term" class:
Note that it is in dollars and the y-axis is a log scale. The takeaway from the chart is that a long term investor's real risk is to be afraid of equities. What is long term? I tell them five years minimum but to think in terms of decades. I also remind them that, actuarilly, a newly retired investor probably has at least a couple of decades ahead.
Agreed, SORR is real but as has been discussed in this thread and many others, the risk can usually be minimized with an appropriate AA. IMO it is not a good reason to be paranoid about equities. Obviously, YMMV.
|
|
|
|
|
11-21-2019, 11:11 AM
|
#77
|
|
Thinks s/he gets paid by the post
Join Date: Dec 2015
Posts: 1,166
|
Quote:
Originally Posted by OldShooter
I don't have any idea what this sentence is trying to communicate. I also don't understand the chart. I tried to find it at https://realinvestmentadvice.com/ but could not. |
It's trying to say that in my opinion, equity risk is often under-appreciated by many - even on ER. I frequently see statements like "what's so bad about a bear market? They typically only last 18 months, on average..". Yes, and they can wipe out 50+% of your equity value. When that happens, it can take DECADES to recover. That's the point I was trying to make.
Quote:
First, it is titled " ... Total Return." Return is conventionally expressed in dollars or as a percentage. The chart does neither.
|
I believe it's exactly that - Total Return (including dividends), as measured in value of an investor's portfolio. The article linked below also says it's adjusted for inflation.
Quote:
|
Second, it appears to be trying to make some point about where the S&P 500 has been since around 1900. Wikipedia, however, tells me that the index was created in 1957.
|
Fair question and good point..let's ask the author (from SeekingAlpha) to net that out. I'd guess he's using other, pre-S&P500 index data for "market return" prior to that point and should have made that more clear in the chart.
Quote:
Third, if it is trying to make some point related to the nominal value of the index this is fallacious because total return, including dividends, is the name of the investing game.
|
My assumption since it said "total" return was that dividends were included.
Quote:
|
Fourth, the whole site is a hustle. For example, they trumpet being in Financial Times list of top advisors. The fine print defines selection criteria: "Applicants were then graded on six factors: assets under management (AUM); AUM growth rate; years in existence; advanced industry credentials of the firm’s advisers; online accessibility; and compliance records." IOW, how good is the firm at selling? Nothing about performance.
|
Not sure that their performance as an advisor is relevant to the core data. If the data is wrong, then it'd be good to show how with hard data to refute the points made.
Quote:
|
@24601NoMore, I'd appreciate a link to the chart and its explanation. I am actually quite curious.
|
Here ya go..
https://seekingalpha.com/article/420...y-happens-next
Quote:
Nobody does. Probably nobody wants to go to the dentist either. But both are good for you in the long term.
Here is a chart I use with my "Investing for the Long Term" class:
Note that it is in dollars and the y-axis is a log scale. The takeaway from the chart is that a long term investor's real risk is to be afraid of equities. What is long term? I tell them five years minimum but to think in terms of decades. I also remind them that, actuarilly, a newly retired investor probably has at least a couple of decades ahead.
|
Good advice, IMHO for young investors or those who are OK with riding out a 10-20 year potential downdraft in their portfolios. It's also often said that you should not have "any" money in equities that you need within the next ten years.
Quote:
|
Agreed, SORR is real but as has been discussed in this thread and many others, the risk can usually be minimized with an appropriate AA. IMO it is not a good reason to be paranoid about equities. Obviously, YMMV.
|
I'm just commenting on my own willingness and need to take risk at this point (year one of ER). I'm not willing to watch a 50+% drop in a big part of my net worth ever again, as I may not have time for things to recover. As Rick Ferri (wisely, IMHO) said most investors should not be investing anywhere near their willingness to take risk, but instead should focus on the minimum amount of risk possible to achieve the income they need. I think that's wise advice and contrary to the "go, 80/90/100% equities!! If a bear market happens, oh well!" I often see on the forum - and from people who really don't "need" to take a 80/90/100% equity position.
So, to net it out - if you don't "need" to take high equity risk to pay the bills and meet your long-term goals through a projected end of life date (I used 95 for us), then as William Bernstein famously said.."when you've won the game, quit playing". I haven't entirely quit playing - but I'm acting tactically by maintaining an AA that the data since 1926 (per Vanguard at https://personal.vanguard.com/us/ins...ations?lang=en) shows returns an average of 6.6% per year with the worst year being -10.1%, the best year being 29.8% and the # of down years being 13 of 93. Contrast that with worst year of -34.9% often followed by probably another year or two of -20+%, avg annual return of only +2.8% above 20/80 and 24 out of 93 down years for an 80/20 AA. To me, an additional 2.8% is not worth that kind of risk to go from 20/80 to say, 80/20 - because watching a 50+% equity melt-down like we did in 2008 is not anything I can or want to repeat at this point in life..and if I can hit an average of 6.6% return over time with a 20/80 AA, then I'm down for that all day long as we would meet all of our financial needs through age 95+ and them some, with that type of return..
|
|
|
|
|
11-21-2019, 11:59 AM
|
#78
|
|
Give me a museum and I'll fill it. (Picasso)
Give me a forum ...
Join Date: Nov 2010
Location: Sarasota, FL & Vermont
Posts: 36,374
|
Quote:
Originally Posted by 24601NoMore
....I frequently see statements like "what's so bad about a bear market? They typically only last 18 months, on average..". Yes, and they can wipe out 50+% of your equity value. When that happens, it can take DECADES to recover. That's the point I was trying to make. ..
|
Quote:
... There are periods in history, where returns over a 20-year period have been close to zero or even negative."
Currently, we are in one of those periods. ...
|
and the article was bullsh!t when it was published and still is.... only in some dumbass view could the one say that we are still in a 20 year cycle of close to zero returns.
$1 million invested in Vanguard Total Stock (VTSMX) on January 1, 2000 would have been worth $3.177 million on October 31, 2019.
Meanwhile, it would take $1.524 million in October 2019 to buy what one could buy with $1 million in January 2000.
ETA: OldShooter's suspicion that dividends were ignored seems to make sense, but is indicative of an author who either is a financial neophyte or has a particular axe to grind.
__________________
If something cannot endure laughter.... it cannot endure.
Patience is the art of concealing your impatience.
Slow and steady wins the race.
Retired Jan 2012 at age 56
|
|
|
|
|
11-21-2019, 12:18 PM
|
#79
|
|
Give me a museum and I'll fill it. (Picasso)
Give me a forum ...
Join Date: Mar 2017
Location: City
Posts: 10,351
|
Thanks for the link. I have just spent a half hour trying to figure out what the guy is trying to say and I'm still not completely sure.
I think he is simply using nominal S&P index values, not total return. It says "Inflation Adjusted S&P Index" on one of his charts. So returns are probably significantly understated.
The chart you posted tells me (I think) that over 115 years, the inflation adjusted return on the S&P index value is about 4.2% and the ride has been wild. Old news, really, but presented in an obscure fashion IMO.
The second chart in the article tells me that there have been periods where the real index growth was flat, hence no returns above inflation. Here is where dividends, if he had considered them, would make a big difference. It also shows, I think, that it is extremely rare that any of the rolling 20 year periods had real returns below typical real returns on bonds. IOW I think that if the calculation was done including dividends the equity investor would never have returns below bonds. IOW either equity always wins or it wins almost all of the time. Hard to know for sure without reams of data though.
Quote:
Originally Posted by 24601NoMore
... So, to net it out - if you don't "need" to take high equity risk to pay the bills and meet your long-term goals through a projected end of life date (I used 95 for us), then as William Bernstein famously said.."when you've won the game, quit playing".
|
Well, yes, if a person's goal is to have his last two checks bounce. Many, probably most, people here have goals for their estates to support children, to educate grandchildren, to benefit a charity, etc. Those are longer long term goals and call for a different AA strategy.
I do like Bernstein and have several of his books on my shelves, but my recollection is that he identified "quit playing" as one reasonable option, not as a recommendation for everyone.
I was reading another thread recently where a poster had an autistic child and the poster's goal was to leave enough money in trust for the child to have as comfortable a life as possible. A much different objective than yours.
Quote:
Originally Posted by 24601NoMore
... I haven't entirely quit playing - but I'm acting tactically by maintaining an AA that the data since 1926 (per Vanguard at https://personal.vanguard.com/us/ins...ations?lang=en) shows returns an average of 6.6% per year with the worst year being -10.1%, the best year being 29.8% and the # of down years being 13 of 93. Contrast that with worst year of -34.9% often followed by probably another year or two of -20+%, avg annual return of only +2.8% above 20/80 and 24 out of 93 down years for an 80/20 AA. To me, an additional 2.8% is not worth that kind of risk to go from 20/80 to say, 80/20 - because watching a 50+% equity melt-down like we did in 2008 is not anything I can or want to repeat at this point in life..and if I can hit an average of 6.6% return over time with a 20/80 AA, then I'm down for that all day long as we would meet all of our financial needs through age 95+ and them some, with that type of return.. |
I think you're saying here that 2.8% is such a small amount that you're willing to forego it over a 20 year period. FWIW, at 2.8%/20 years $100,000 becomes $173,725. For myself, that would be a very expensive sleeping pill but if it works for you that's fine with me.
|
|
|
|
|
11-21-2019, 12:20 PM
|
#80
|
|
Recycles dryer sheets
Join Date: Jan 2011
Location: Hilton Head Island
Posts: 325
|
69 years old 71/25/4
Let me add that SSA will provide about 40% of our spending needs. We have 2 rental properties that will provide about 20% of our spending needs and withdrawal rate will use up all our funds by age 105, assuming a 3% real rate of return.
Net, somewhat aggressive on equities, but we have a lot of spending flexibility to help us deal with market issues.
|
|
|
|
|
|
|
Currently Active Users Viewing This Thread: 1 (0 members and 1 guests)
|
|
|
 Posting Rules
|
You may not post new threads
You may not post replies
You may not post attachments
You may not edit your posts
HTML code is Off
|
|
|
|

 » Recent Threads
|
|
|
|
|
|
|
|
|
|
|
|
|
|
|
|
|
|
|
|
|
|
|
|
|
» Quick Links
|
|
|


 Linear Mode
