Asset Allocation & SWR History Revisited

Midpack

Give me a museum and I'll fill it. (Picasso) Give me a forum ...
Joined
Jan 21, 2008
Messages
21,323
Location
NC
Nothing most haven't seen before.

There are no "right" or "better" choices, they're all viable - but not interchangeble. They are choices we're all confronted with like it or not...
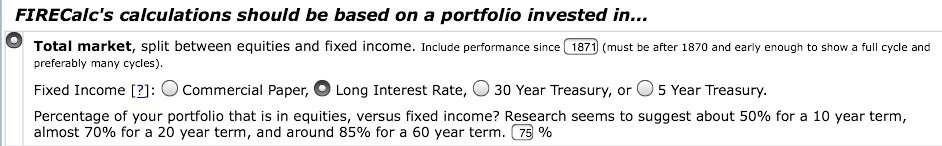
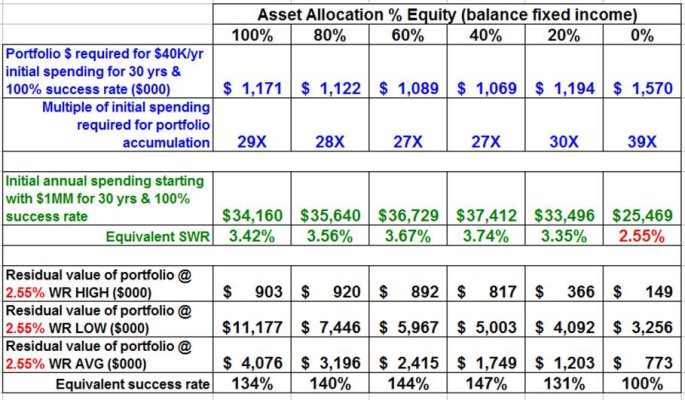
  • It seem popular lately, so I used 100% success rate as indicated, which alters the results some might expect (most SWR studies typically assume 95% success).
  • All based on 30 years.
  • Assumes inflation adjusted spending after initial year.
  • All generated using FIRECALC 1871-present, which includes 3 depressions, 20 recessions, 4 panic/bubbles (market shocks), 2 World Wars & 1 "Great Recession" 2008-09. List of recessions in the United States - Wikipedia, the free encyclopedia
  • None of us can predict the future, and no calculator can or ever will. These historical tools are simply used as basis for planning. The user must factor in their own circumstances, outlook, risk tolerance, etc. and adjust accordingly. And even once the plan begins, we adjust our spending, reallocate assets, etc. as needed. We all hope to be pleasantly surprised, but we prepare for some downside of our choosing.
Good arguments have been made for lower equity returns in the future, fixed income/cash yields are already historically awful at least for the foreseeable future, and many popular indicators suggest our economy may not be as robust as it once was. There are no easy answers anywhere.
 

Attachments

  • Cash.jpg
    Cash.jpg
    103.1 KB · Views: 133
Last edited:
Nice chart Midpack.

Could you clarify a couple of things?
- Are the residual values in nominal amounts or real?
- What does "Equivalent success rate mean"?
 
Could you clarify a couple of things?
- Are the residual values in nominal amounts or real?
- What does "Equivalent success rate mean"?
- "Note: values are in terms of the dollars as of the beginning of the retirement period for each cycle" from FIRECALC. I wouldn't bet my life on the exact numbers, I was hoping to illustrate the relative differences between the AA's first and foremost.
- Instead of just showing GT 100%, I used the 0:100 AA 2.55% WR (since it was actually 100%) as the denominator, and used each SWR as the numerator to arrive at an equivalent for each respective AA. Thanks, good question.
LakeTravis said:
Are WR High and WR Low reversed?
Yes thank you, my bad. :facepalm: I'd edit but that option is gone.
 
Last edited:
I like the chart. With the exception of the 0% equity allocation, your withdrawal level for 100% success does not very a whole lot so the choice of equity level within a reasonable range is yours. T Rowe Price used to have a tool that showed this type of data using Monte Carlo simulations (its no longer available). The additional info it showed was the tremendous up side possibilities to gaining wealth as you moved higher in the equity allocation while still maintaining the 100% success factor.
 
Midpack, what did you use for the fixed income allocation?
 
With the exception of the 0% equity allocation, your withdrawal level for 100% success does not very a whole lot so the choice of equity level within a reasonable range is yours. The additional info it showed was the tremendous up side possibilities to gaining wealth as you moved higher in the equity allocation while still maintaining the 100% success factor.
True, depends on whether you value income or residual upside. Most retirees seem to favor the former, especially since the high equity AA's have historically provided a heart-stopping ride!
Midpack, what did you use for the fixed income allocation?
I just left fixed income on FIRECALC default (see below) and varied the % equity. Most likely optimistic for fixed income, but many would say so are equity returns from where we are today. And my goal was illustrating relative AA's, not exact $ which is not possible anyway.
 

Attachments

  • image.jpg
    image.jpg
    60.9 KB · Views: 21
Last edited:
"Percentage of your portfolio that is in equities, versus fixed income? Research seems to suggest about 50% for a 10 year term, almost 70% for a 20 year term, and around 85% for a 60 year term. "

Is the quote above from FIRECalc referring to "term" as years until retirement or years in retirement?
 
"Percentage of your portfolio that is in equities, versus fixed income? Research seems to suggest about 50% for a 10 year term, almost 70% for a 20 year term, and around 85% for a 60 year term. "

Is the quote above from FIRECalc referring to "term" as years until retirement or years in retirement?
I can guess, but I don't know. You might want to ask in the FIRECALC support forum, one of the long standing members may know. And "60 year term" might be a typo - I wouldn't think anyone would plan on a 60 year retirement, or plan to save for 60 years before retiring except Methuselah...
 
Last edited:
Back
Top Bottom