Calling all spreadsheet geeks. Spend down plan.

Surewhitey

Thinks s/he gets paid by the post
Joined
Mar 5, 2011
Messages
1,849
Location
North TX
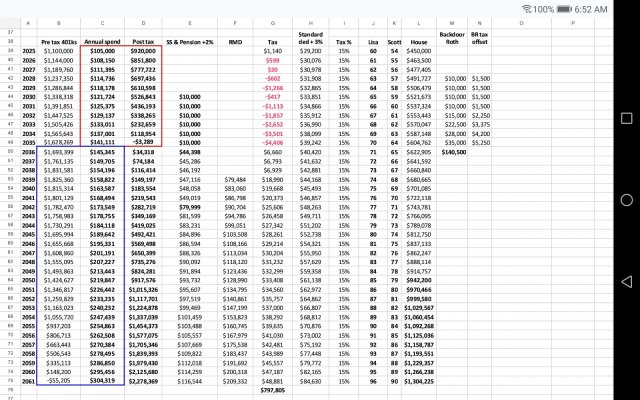
Spent a little time trying to make my explanation for DW on our situation. I'd love some input on your ideas and hole poking.

Very high view of spending & accounts to pull from here. Red pill is the post tax drawdown and possible ACA benefits. Our spending is ~$70k, so a $105k would give us some wiggle room for lumpy stuff.

The blue pill is pre tax accounts with RMDs & a 15% tax on everything (gotta start somewhere).

SS & Pension will be fluff going back into the post tax & grow for future needs. All growth is a modest 4% assumption.

I'd love some feedback from the spreadsheet nerds out there. Anything I can do to simplify?
 

Attachments

  • Screenshot_20240408-065257.jpg
    Screenshot_20240408-065257.jpg
    598.4 KB · Views: 240
Last edited:
So you're spending in red, this will/not include ACA? Do you have an idea what your cost will be for a plan for two? I'm struggling with this now...
 
I understand much of spreadsheet, but I'm confused on a few areas.


Is the plan to live off post tax money for the next 10 years will little tax due? If so, why does Tax column show 15%, isn't it lower? Can Lisa take out some 401K money during those 10 years to utilize the <15% tax brackets?
 
Here you have several things that don't look right.

Why not go to bogleheads.org and download the free Retiree Portfolio Model spreadsheet from their wiki. It does a much better job on taxes, RMDs, IRMAA tiers, etc. It is much more complex of course and takes time to learn.

If planning ACA premium credits or Roth conversions are important to you (it looks like you are in the range where they could be important), then a paid tool like Pralana Gold would benefit you as it has various optimizers and tricks- to plan Roth Conversions, instead of guessing a $ amount, you select a tax bracket, IRMAA tier, FPL multiple, whether to stay below the LTCG tax phase-in, etc.

With a home-grown tool, you will either spend an eternity learning about and programming in the tax code or the tool will be too coarse to see the actual trade-offs of your choices.
 
I understand much of spreadsheet, but I'm confused on a few areas.


Is the plan to live off post tax money for the next 10 years will little tax due? If so, why does Tax column show 15%, isn't it lower? Can Lisa take out some 401K money during those 10 years to utilize the <15% tax brackets?

Yes on the 10 years. I just used 15% for the later years. I didn't get too granular but there will be at least a little tax on the gains as we go.

Yes on the 401k question and in the "negative" tax years, we'll likely do some Roth conversions or draw down the 401k in general.

Regarding the health insurance vs ACA, I haven't went down the rabbit hole to keep the story simple...
 
So you're spending in red, this will/not include ACA? Do you have an idea what your cost will be for a plan for two? I'm struggling with this now...

Even without ACA, I have ~$30k fluff for insurance and lumpy things. Just depends on how much Roth conversions we may do. This is just a starting point for explaining the basics.
 
Here you have several things that don't look right.

Why not go to bogleheads.org and download the free Retiree Portfolio Model spreadsheet from their wiki. It does a much better job on taxes, RMDs, IRMAA tiers, etc. It is much more complex of course and takes time to learn.

If planning ACA premium credits or Roth conversions are important to you (it looks like you are in the range where they could be important), then a paid tool like Pralana Gold would benefit you as it has various optimizers and tricks- to plan Roth Conversions, instead of guessing a $ amount, you select a tax bracket, IRMAA tier, FPL multiple, whether to stay below the LTCG tax phase-in, etc.

With a home-grown tool, you will either spend an eternity learning about and programming in the tax code or the tool will be too coarse to see the actual trade-offs of your choices.

I'll check that out. Thanks for the suggestion. I've done the Fidelity calculator and it says no problems...just not sure if it's a detailed tax strategy planning tool.
 
I'll check that out. Thanks for the suggestion. I've done the Fidelity calculator and it says no problems...just not sure if it's a detailed tax strategy planning tool.

I use both RPM and Fidelity. Fully agree that RPM is very robust, and customizable, but be forewarned, the learning curve is steep. Fidelity is nice because it runs kind of a historic/Monte Carlo simulation (I can't quite tell what they're doing behind the scenes) and gives you a score.
 
Spent a little time trying to make my explanation for DW on our situation....
I'd love some feedback from the spreadsheet nerds out there. Anything I can do to simplify?

First, is your wife a spreadsheet nerd? If not, she will glaze over on this. I would, and I spent a lot of my life deep in spreadsheets.

Bottom line it. This is where we'll be at 70, 80, 90, at most. Have the details, but start with a higher level summary.

Focus on how your audience receives information vs. how you like to share it.
 
FYI, I can't really follow your spreadsheet. I don't understand what the post-tax column represents, nor do I understand how you're calculating taxes.
 
I am a spreadsheet nerd but I think you've lost your audience on assumptions that you have not spelt out.

At a glance, your pre-tax 401K should never go to zero if you use the RMD table, and I see that the last line shows a negative number. Are you using RMD table or are you simply using your own percentages?

You are both taking your SS at 70. Have you used opensocialsecurity.com on the when to take your SS? At a glance, I would think that Lisa should take at 70 while Scott at 62.

Since you are depleting the first 10 years of taxable accounts, you have to figure out whether you have enough money to pay for additional taxes when you do ROTH conversions.

On the other hand if Scott is taking SS at 62, it should provide you with additional income to cover taxes for ROTH conversions but you have to figure out how much and at what tax bracket that you want to convert up to.
 
Last edited:
I am a spreadsheet nerd but I think you've lost your audience on assumptions that you have not spelt out.

At a glance, your pre-tax 401K sould never go to zero if you use the RMD table, and I see that the last line shows a negative number. Are you using RMD table or are you simply using your own percentages?

You are both taking your SS at 70. Have you used opensocialsecurity.com on the when to take your SS? At a glance, I would think that Lisa should take at 70 while Scott at 62.

Since you are depleting the first 10 years of taxable accounts, you have to figure out whether you have enough money to pay for additional taxes when you do ROTH conversions.

On the other hand if Scott is taking SS at 62, it should provide you with additional income to cover taxes for ROTH conversions but you have to figure out how much and at what tax bracket that you want to convert up to.

Ahh, I think I'm starting to get it. Post-Tax is showing the Taxable account and that is being depleted first. But, then why does it start growing again before RMD's begin.
 
I agree with exchme - use the bogleheads spreadsheet or pralana gold. Taxes have complex interactions and it is better to use a vetted tool that has a large, interested audience & is updated regularly.


To explain your plan to another person, use graphs rather than a spreadsheet.
 
Ahh, I think I'm starting to get it. Post-Tax is showing the Taxable account and that is being depleted first. But, then why does it start growing again before RMD's begin.

I just pushed the SS (after tax) into that and let it grow (basically saying we don't rely on SS, but it will be this much if it comes in). Again, rough numbers.
 
First, is your wife a spreadsheet nerd? If not, she will glaze over on this. I would, and I spent a lot of my life deep in spreadsheets.

Bottom line it. This is where we'll be at 70, 80, 90, at most. Have the details, but start with a higher level summary.

Focus on how your audience receives information vs. how you like to share it.

Good point...she's smart but not likely interested in the details.
 
I am a spreadsheet nerd but I think you've lost your audience on assumptions that you have not spelt out.

At a glance, your pre-tax 401K sould never go to zero if you use the RMD table, and I see that the last line shows a negative number. Are you using RMD table or are you simply using your own percentages?
Yeah, using my own % and going to zero as we likely will not make it to 90/96...we still have the SS $$'s for a backup / inheritance

You are both taking your SS at 70. Have you used opensocialsecurity.com on the when to take your SS? At a glance, I would think that Lisa should take at 70 while Scott at 62.

Since you are depleting the first 10 years of taxable accounts, you have to figure out whether you have enough money to pay for additional taxes when you do ROTH conversions.

On the other hand if Scott is taking SS at 62, it should provide you with additional income to cover taxes for ROTH conversions but you have to figure out how much and at what tax bracket that you want to convert up to.

Good point on taking SS at 62 or maybe 65 for funding the conversions

comments in blue
 
I don't think the OP is looking for definitive answers as much as an explanatory graphic

OP, maybe present the info as a line graph of account levels, with a page for every 10 years. That should illustrate how you will spend and that you will not run out.
 
Here are a couple of things:

1. Looks like the amounts in the post tax column (assuming they are Beg of Year amounts) for the following years have the 4% growth rate applied to the entire amount before any amounts in the annual spend column were subtracted out. i.e. Post tax amount for year 2026 should not be $851.8K ($920k X 4% - $105K) as you won't be making interest/growth on 100% of the money throughout the entire year as it's being spent down.

2. Suggest adding another column(s) for estimated dividend, interest and capital gains income. You may incorporate this into your annual spend, allow you to fine-tune your taxes, and it would help you better plan for possible ROTH conversions in the future.

3. Are taxes included in your annual spend column?
 
Another approach might be to forget about the spreadsheet and show her FIRECalc and use the Investigate tab to solve for your safe level of spending... spending with 95% success.

I put in $2,020,000 and 45 years... $10,000 fixed pension starting in 2030, $34,398 of SS starting in 2036 and $30,980 SS starting in 2042... and on the Investigate tab select the last option...
Given a success rate, determine spending level for a set portfolio, or portfolio for a set spending level

Search for settings that will get a success rate of as close to 95 % as possible (usually within 1%) by changing... Spending Level

and click on Submit. The result is:
... A spending level of $102,164 provided a success rate of 95.4% (109 total cycles, of which 5 failed). This spending level is 5.06% of your starting portfolio. (Your spending is assumed to come from any Social Security and pensions you entered, as well as from the portfolio.) ...

Since $102,164 is 146% of your current $70k spending, you have loads of room for adverse deviations without worrying about running out of money.
 
Last edited:
I'd make TWO spreadsheets. The first would be much simpler than this one. I know spreadsheets pretty well, and I also like looking at and dealing with numbers, but this spreadsheet is way too busy.
For the first spreadsheet, basic info such as total assets, planned withdrawals, and not much else beyond truly critical details. Make a 2nd Tab with as much detail as you want, in event your DW needs that info (or can show someone else for assistance). On the first, simple, spreadsheet, use larger font, and all caps, in one cell at the top that points out there is a 2nd Tab.
 
Last edited:
As pb4ski notes, based on your assets and spend rate you seems to have plenty of money to retire, so I'm somewhat curious about the point of the spreadsheet. Is it to insure you won't run out of money and/or to convince the DW that you won't; or decide when to retire, etc.?

I have a large spreadsheet file with lots of worksheets, but only one worksheet goes out very far in time (i.e my "withdraw amounts" worksheet), which shows a type of 3 year rolling average withdraw percentage that goes to 100% withdraw from our portfolio when I reach 105 in age. :LOL: I have no inflation forecast or portfolio growth forecast, as I don't believe I need this information. We are all very different in terms of our goals, e.g. do we have kids, etc., so there is no spreadsheet that fits us all. I would focus on what you want/need out of your spreadsheet and build it to match that need.

Full disclosure, I have never ran FireCalc or any other retirement software package. Why? Because I never felt the need.
 
If your wife is like mine, I'd hide all columns except A, B, C, J & K. Then apply the Round function to all $ values: Round (Cell#, -3) to show all values in thousands. If she questions how you got the numbers, you can unhide the other rows, and her eyes will likely glaze over, as she says, okay, I'm good. My wife seems to trust my financial management. Hope yours does too!
 
So you're spending in red, this will/not include ACA? Do you have an idea what your cost will be for a plan for two? I'm struggling with this now...

Here's the ACA calculator that I used:
https://www.kff.org/interactive/subsidy-calculator

In general, my wife and I have a silver plan with AGI of $37K and pay $50/month with a max out of pocket of $6K. I've found that if you keep your AGI < ~$45K, your rates stay low. Higher than $45K, ours would have jumped to $150/month.

Last year we had a Bronze HSA plan with AGI of $37/K and paid $15/month. Our max out of pocket was $15K and were able to deduct $9.7K off our AGI.
 
I would swap B and D and get 401K next to post tax. Also, what is House?
 
As a spreadsheet geek (former satellite engineer), I present a similar simplified chart to my wife. I would add a column that adds all your money together.

Personally, I would present it as column A (Year), column B (Lisa age), column C (Scott age), column D (total money), column E (annual spend), then the balances of post, pre, SS, etc). Think of it at a high level from left to right - at this year, we are x years old and here's how much money we have, how much we spend, and then the individual breakdown.

Also, I would demonstrate that by manually changing C39 (initial spending level), you can show in the spreadsheet quickly how much TOTAL money is remaining and at what spend rate you go broke at the end.
 
Back
Top Bottom