ladelfina
Thinks s/he gets paid by the post
- Joined
- Oct 18, 2005
- Messages
- 2,713
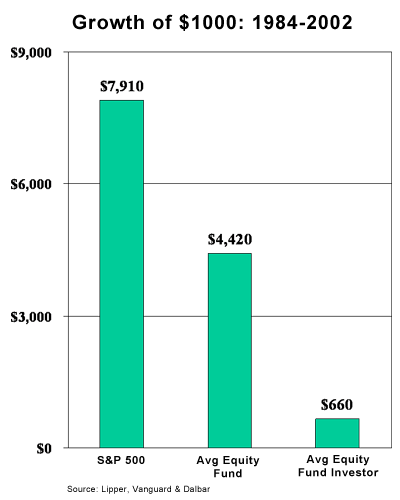
Leafing just yesterday through the free Schwab magazine (I wish they would save money and not send it me).. I came across this inexplicable chart:
http://oninvesting.texterity.com/oninvesting/2007fall/?pg=12
Which claims annualized return 1986-2006 for "equity mutual fund investors" as follows:
"Average investor" = 4%
"Average systematic investor" = 6%
"Average market timer" = 2%
CPI = 3%; S&P500 index = 12%.
[This is all in the context of denouncing market timers, BTW, but bear with me..]
Source is DALBAR (www.dalbarinc.com) but their reports are for sale so I couldn't check. -- I know the whole routine about how most funds lag the S&P, but I had no idea the magnitude of the figure -- 4% return seems insanely low!
Then today I found this:
http://johncbogle.com/wordpress/200...al-funds-the-wall-street-journal-july-8-2003/
which also references Dalbar.. does anyone have more insight into how this "Dalbar" number is figured? Even if the market timers do half as well as "average", how can it be possible that people switching in and out in a random, blundering way is to blame for a six-to-seven-fold discrepancy between fund performance and "avg. investor" performance?
- Sometimes you will find something of value in fluff publications
- It's funny the Schwab chart, intending to prove something else, gives the lie to arguments for equity-fund investing made on the other pages of their same magazine.
- I may become a "Boglehead" (though I am not sure of exactly what that means nor all the ramifications thereof)!
")