Figuring NET portfolio gain

marko

Give me a museum and I'll fill it. (Picasso) Give me a forum ...
Joined
Mar 16, 2011
Messages
8,426
Just as when trying to play golf, whenever I play with numbers, it often doesn't end well.

I've been playing with numbers again. Hoping some of you can help me interpret what I'm seeing.

Like most of you, I track my annual portfolio return. I use my own spreadsheet and compare it with M* and they closely corroborate.

But as a 'never touch the principle' guy, what I'm really interested in is my 'net' return, which is my return that includes my gains/losses as well as my withdrawals. In short, I'm trying to gauge the portfolio's progress despite my withdrawals.

What I've done is go back to my January 1 start balances for each year since 2006. I figure that each Jan 1 balance will include all my gains/losses and withdrawals from the previous year.

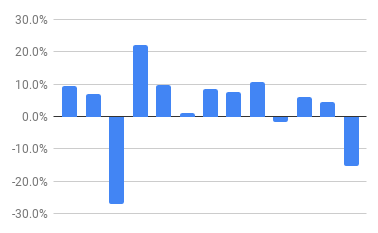
What I found is that since my start (2006), my average annual gain is ~3.5% which would include gains and withdrawals. I also found that I doubled my portfolio in 11 years, which included the 2008 debacle.

I've had only two negative years --2008 and 2018-- but since my overall gain is 3.5%, I believe this tells me that despite my withdrawals and occasional market loses, I'm still in good shape considering everything.

Am I missing something or does this make sense? Can I assume that as long as my 2006 to present stays positive that I'm moving in the right direction? Should I be looking at a shorter time frame than starting at 2006?

Note that 2018 really skewed the numbers; not only was it a bad year but we also withdrew a heck of a lot more than usual for a renovation project. If I take out '18 my net return since '06 is more like 7%...but I know you can't do that.

I've demonstrated here time and again that I have a true blind spot when it comes to math (pls be kind) so any insight appreciated.
 
Last edited:
You are not really determining your net investment return. For that, you would have to add back your withdrawals. What you are showing is that your withdrawal rate is lower than your investment return, and that the difference between the two is 3.5%.
 
You are not really determining your net investment return. For that, you would have to add back your withdrawals. What you are showing is that your withdrawal rate is lower than your investment return, and that the difference between the two is 3.5%.
He never said he was considering his investment return. In fact he very specifically said he was looking to measure his portfolio return including withdrawals.

One think I see off about the numbers, the "rule of 78s" says that with a 3.5% return, it would take 22 years to double your money, instead you said it took you 11, so something is off. I don't know how you came up with that 3.5%.

One thing you could do is look at the graph or numbers produced by Firecalc, and see where your situation fits in that. I suspect it would be in the range of very successful scenarios.

I think it's the "Rule of 72" but regardless.

I doubled my total with a return of about 6.6% from 2006 to 2017. As noted, if I ignore 2018 my 3.5% goes to about 7.0%. 2018 was down 15% from both heavier than normal withdrawals and market action.
 
Last edited:
What I've done is go back to my January 1 start balances for each year since 2006. I figure that each Jan 1 balance will include all my gains/losses and withdrawals from the previous year.

What I found is that since my start (2006), my average annual gain is ~3.5% which would include gains and withdrawals. I also found that I doubled my portfolio in 11 years, which included the 2008 debacle.

I've had only two negative years --2008 and 2018-- but since my overall gain is 3.5%, I believe this tells me that despite my withdrawals and occasional market loses, I'm still in good shape considering everything.
I track monthly increase, then sum for EOY end of year. It sounds like we have similar method.
 

Attachments

  • Clipboard01.png
    Clipboard01.png
    30.6 KB · Views: 54
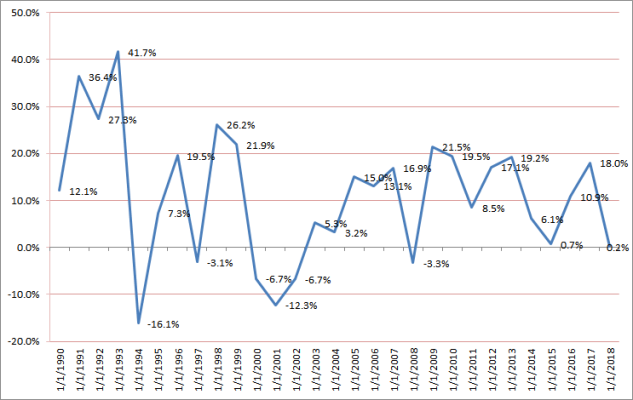
Here is my start of year from 2006 to Jan 2019

chart.png
 
Last edited:
Are you a Fidelity customer? They calculate this for you under the “performance” tab.
 
Are you a Fidelity customer? They calculate this for you under the “performance” tab.
I'm with TRowe. They have a "Personal Rate of Return " but it is so convoluted in the calculations that I think even our "mathjak" would be buffaloed.
 
I do track my net worth over the years. So this number includes any funds spent as well as the value of my assets.

And I track it against inflation. I usually update my spreadsheet about 4 times a year.

But I haven't annualized the return. I guess I don't really care about the annual gain, just about whether I'm staying ahead of inflation over the long run.

It's just a benchmark. I don't care about dipping into "principal". But I know that if my net worth is keeping up with inflation, then I am way ahead of the game IMO.
 
Last edited:
I have been driving myself Crazy flipping numbers around and obsessing over them. (!)

My new strategy is this:

> I have a Plan.

> On any given spot check, if I have an equal or greater Net Worth than I had planned upon at that given point in time - I am "Happy".

> If my Net Worth is any less than planned at any given point - I am "Sad", and will investigate what has caused the discrepancy.

Now, if I can just follow my own advice and QUIT playing with numbers, scenarios, possibilities and Coulda'-Shoulda'-Woulda'... I think I'll be Okay.

:)
 
Last edited:
I do track my net worth over the years. So this number includes any funds spent as well as the value of my assets.

And I track it against inflation. I usually update my spreadsheet about 4 times a year.

But I haven't annualized the return. I guess I don't really care about the annual gain, just about whether I'm staying ahead of inflation over the long run.

It's just a benchmark. I don't care about dipping into "principal". But I know that if my net worth is keeping up with inflation, then I am way ahead of the game IMO.

Yes. Having doubled my number over the years I'm less worried about dipping into the original principle (ooops...principal).

Like you, I'm more interested in staying ahead of inflation and keeping track of my progress.
 
Yes. Having doubled my number over the years I'm less worried about dipping into the original principle (ooops...principal).


Looks like your only 'problem' is not spending enough. Time to blow that dough!
 
Yes. Having doubled my number over the years I'm less worried about dipping into the original principle (ooops...principal).

Like you, I'm more interested in staying ahead of inflation and keeping track of my progress.

It might look like it has doubled. But if you adjust for inflation you will find a lower answer, but the "real" answer.

I use this cumulative inflation calculator: https://inflationdata.com/inflation/inflation_calculators/Cumulative_Inflation_Calculator.aspx

For example, for inflation from 2000 to the present, you put in Dec 1999, then Feb 2019 which is the most recent CPI, and $1. You get 50.19% which is a big cut into any gain since then as spending power has been reduced by 33% since Dec 1999.
 
I’ve given up on any fancy methods to track return. I simply look at my year end net worth (which takes into account growth of investments and withdrawals) figure out the year over year nominal return and year over year real return (inflation-adjusted), smile and then forget about it. Making the spreadsheets too complicated and over-thinking it is too easy so I try to avoid that.
 
There is no single true measurement, but I agree that any palliative is better than not measuring performance at all.

Many many moons ago I found this method somewhere on the net, presented together with its reasoning, which I thought was sound enough for my purposes.

It uses 4 values:
Bstart (starting balance) for the year
Bend (ending balance)
N (net annual additions to the p/folio = additions minus withdrawals)
Y (the elapsed time in years if measured over more than a single year, otherwise Y = 1).

and the return rate is

r = [ ( Bend - N / 2 ) / ( Bstart + N / 2 ) ] ^(1/Y) - 1


The logic applied is that
(Bstart + N/2)* grew to (Bend - N/2) for the measured period.

This is what I have used, and it gives me a comparable annual metric.

No emoji for 'eyes glazing over' (but that's just me)

This looks similar to how TRowe does it but they include the timing of one's sales/additions/withdrawals (at what date during the year you did so) which tends to produce an entirely different number and, IMO while perhaps more accurate, not very useful.

Having said that, as a noted mathophobe, I'll have to stay with less complicated calculations and be happy with my lifetime 'close enough' approach.

TR's 'since incept/2006' number (and perhaps yours) gives me 5.5% while my Excel run gives me 3.5% which either way is a positive number and somewhat ahead of inflation which is what I'm really looking to know.
 
Update:

Oops, I did it again!

I just realized that I was dividing my gain by my most recent, larger number rather than my starting number.

That sends my gain since incept (2006) from 3.5% to 5.2%

Numbers are hard. But thanks all for the help with this question.
 
The forumla below replicates the moneychimp calculator:

=AVERAGE(RATE(Period in years,-Additions+Dividends+Withdrawals,-Starting balance,Ending balance,1),RATE(Period in years,-Additions+Dividends+Withdrawals & Withdrawals,-Starting balance,Ending balance,0))

Or you can just use the moneychimp calculator

Investment Return Calculator: Measure your Portfolio's Performance

The above presume that additions, dividends and withdrawals all happen ratably throughout the year.... if they are lumpy then you may want to us XIRR.
 
Last edited:
I've demonstrated here time and again that I have a true blind spot when it comes to math (pls be kind) so any insight appreciated.
You may have that blind spot, but you seem to have patience (going back through all those statements), so I'll give you the precise way to get your rate of return.

I'm guessing that you're basing this off of one investment account, and you consider the money "spent" when it leaves that one investment account.

What you'd do is make a pair of columns in a spreadsheet with a date column and a dollar value column. The first entry is a beginning balance, and is positive. The next set of entries are any withdrawals you have, one per date. These are negative values. You get to ignore all transactions that don't "break the barrier" into or out of of the account! So interest, dividends, re-balancing, selling or buying things...those all can be ignored, lucky you! Just if you pull money out, or put money in does it need an entry. So if you happen to add to the account, that would go in as a positive value. Finally, the last entry is minus the ending balance. Then, in an empty cell you type (no quotes) "=xirr(" then draw a box around the numbers, they type "," and draw a box around the dates, then type ", .1)" and hit enter. If you think you lost money, you might need to type ",-.1)", because rate of return needs that "guess" as a starting point for it's calculation.

I just did a quick test. I typed 12/31/2018 into a cell and 100000 into the cell to the right of the date. Then put dates in for each month-end, and put -1000 in each cell. So the test presumes a $1000 withdrawal on the end of each month. So after you have 12 additional cells with -1000 along with the associated month-end dates to the left, add one more cell for your ending balance. Say your ending balance after your last withdrawal was $90K, so you'd add a 14th value of -90000. Then you write the XIRR formula as described above and it says your rate of return was 2.11%.


The cool thing about the XIRR formula is that you can have transactions on any date (not just aligned with month-end). And your duration doesn't need to be exactly one year either; if you put in the beginning balance on June 30 and the ending balance on December 31 and the transactions between, it will tell you what your annualized rate is, which is kind of the comparison number that everyone uses. So for instance if your starting balance on June 30 was 95000 and ending balance on 12/31 was 90000 and you pulled out 6 $1000 withdrawals, XIRR would give 2.16% (comparable to 2.11%, even though the span of time was not the same, the two can be compared since they are annualized).
 
It might look like it has doubled. But if you adjust for inflation you will find a lower answer, but the "real" answer.

I use this cumulative inflation calculator: https://inflationdata.com/inflation/inflation_calculators/Cumulative_Inflation_Calculator.aspx

For example, for inflation from 2000 to the present, you put in Dec 1999, then Feb 2019 which is the most recent CPI, and $1. You get 50.19% which is a big cut into any gain since then as spending power has been reduced by 33% since Dec 1999.

A bit off topic and I know inflation comes up in many other threads but since you mentioned it above: 75% (give or take) of the average persons budget is housing, transport and food. In 1999 I was paying on a 8.16% mortgage. I had 2 car payments and no garden. Now I have a 3.38% mortgage (current equity equals 3X what the 99 house was worth), I have no car payment and I offset food costs with a garden. I don't doubt the published CPI I just don't think it is a huge boogey man.
 
A bit off topic and I know inflation comes up in many other threads but since you mentioned it above: 75% (give or take) of the average persons budget is housing, transport and food. In 1999 I was paying on a 8.16% mortgage. I had 2 car payments and no garden. Now I have a 3.38% mortgage (current equity equals 3X what the 99 house was worth), I have no car payment and I offset food costs with a garden. I don't doubt the published CPI I just don't think it is a huge boogey man.

+1 IMO there is a difference between formal inflation and what YOUR personal inflation might be.

For us, DW will take SS next year (a $22K reduction in withdrawals) and a few short years after, get on Medicare (a $15K reduction in withdrawals). We also have other costs going away and some other assets joining the portfolio in the next few years. Someday, I may also decide to dump that huge Mercedes lease and get a Toyota as well....maybe.

Agreed, it does not change how true inflation impacts one's calculations (like when things have doubled--or not) but one's personal inflation, and how we react to it via withdrawals or cutting back is somewhat different. In the end, IMO it's about what your personal cash outlay is each year.
 
Last edited:
You may have that blind spot, but you seem to have patience (going back through all those statements), so I'll give you the precise way to get your rate of return.

I'm guessing that you're basing this off of one investment account, and you consider the money "spent" when it leaves that one investment account.

What you'd do is make a pair of columns in a spreadsheet with a date column and a dollar value column. The first entry is a beginning balance, and is positive. The next set of entries are any withdrawals you have, one per date. These are negative values. You get to ignore all transactions that don't "break the barrier" into or out of of the account! So interest, dividends, re-balancing, selling or buying things...those all can be ignored, lucky you! Just if you pull money out, or put money in does it need an entry. So if you happen to add to the account, that would go in as a positive value. Finally, the last entry is minus the ending balance. Then, in an empty cell you type (no quotes) "=xirr(" then draw a box around the numbers, they type "," and draw a box around the dates, then type ", .1)" and hit enter. If you think you lost money, you might need to type ",-.1)", because rate of return needs that "guess" as a starting point for it's calculation.

I just did a quick test. I typed 12/31/2018 into a cell and 100000 into the cell to the right of the date. Then put dates in for each month-end, and put -1000 in each cell. So the test presumes a $1000 withdrawal on the end of each month. So after you have 12 additional cells with -1000 along with the associated month-end dates to the left, add one more cell for your ending balance. Say your ending balance after your last withdrawal was $90K, so you'd add a 14th value of -90000. Then you write the XIRR formula as described above and it says your rate of return was 2.11%.


The cool thing about the XIRR formula is that you can have transactions on any date (not just aligned with month-end). And your duration doesn't need to be exactly one year either; if you put in the beginning balance on June 30 and the ending balance on December 31 and the transactions between, it will tell you what your annualized rate is, which is kind of the comparison number that everyone uses. So for instance if your starting balance on June 30 was 95000 and ending balance on 12/31 was 90000 and you pulled out 6 $1000 withdrawals, XIRR would give 2.16% (comparable to 2.11%, even though the span of time was not the same, the two can be compared since they are annualized).

Thanks Seng. I'll give it a go...rainy day here in S. Florida so I might dig in later today.

Actually, I didn't have to dig through any statements. TRPrice give me all my monthly balances with just a click. I just enter any date for the past 15 years (more maybe) and they tell me my balance on that day. I just chose 1/1/XXXX for each year and went from there.
 
Last edited:
Here's my way of calculating net portfolio gain or loss, when you have withdrawals or additional deposits. It might be a bit simple and sloppy, but I think it gets you most of the way there.

First, let's pretend you had $100K on 1/1/18.
On 6/1/18, you withdrew $10K.
On 12/31/18, you ended the year with $85K.

I'd run two sets of calculations. The first would be (85000+10000)/100000, which comes out to .95

The second would be 85000/(100000-10000), which comes out to .944444...

Then, take the average of the two (.95+.9444....)/2. Which comes out to .947222.... Or down .052777...

So, in this case, the portfolio was down about 5.278%

It's not exact, but close enough for government work, I guess.

In my case, I've been keeping track since 1998. I saw a negative return in 2000, 2001, 2002, 2008, 2011, and 2018. However, because of additional investments, my net worth was actually up in 2000 and 2011, so NW only fell in 2001, 2002, 2008, and 2018.
 
Or for the year you lost $5,000 ($100,000-$85,000-$10,000).

Your average investment for the year was $100,000 for 5/12 of the year and $90,000 for 7/12 of the year or $94,167.

So your return was -5.3%.... XIRR is -5.33%... close enough.
 
Back
Top Bottom