FIRECalc vs REW

Isn't it actually that your portfolio shrank in 2015? It dropped due to your withdrawal at the beginning, then probably went down some due to market drops.
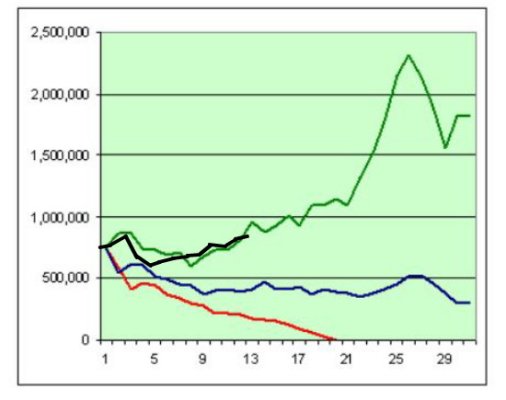
The graph in post #91 shows how my portfolio has performed (relative to the three FIRECalc examples) since 2005. The 2015 portion of the line has a slightly downward slope.
 
I would assume this scenario is not based on a bucket strategy where at least 2-3 years of income is set aside in cash accounts to be used before mid and long term investment buckets?


Sent from my iPad using Early Retirement Forum
 
I would assume this scenario is not based on a bucket strategy where at least 2-3 years of income is set aside in cash accounts to be used before mid and long term investment buckets?


Sent from my iPad using Early Retirement Forum

Don't most bucket strategies have a plan for refilling the cash bucket along the way...

In other words - the bucket strategy is just a normal asset allocation with the cash/fixed portion being the cash bucket.

If you just use up the cash bucket, without refilling it - what happens if the market is down when you run out of cash?
 
Update:

Since there was some recent discussion of this old thread I thought I would update the graph showing where I stand after 12 years of retirement.

Note that this reflects nominal dollars - no adjustment for inflation.
 

Attachments

  • REW 12 year plot.jpg
    REW 12 year plot.jpg
    49.9 KB · Views: 104
Update:

Since there was some recent discussion of this old thread I thought I would update the graph showing where I stand after 12 years of retirement.

Note that this reflects nominal dollars - no adjustment for inflation.

Excellent, REWahoo! This is sure encouraging.

(Just to remind people with memories as hazy as mine, the origin/meaning of these lines is explained in the first post of this thread.)
 
Thanks. Great news. Just to make sure I understand, is the green line the best possible outcome in Fire Calc, the red line the worst, and the blue line the nominal or average?

Would be interesting to know if you look at all the scenarios after 12 years, what percentile are you at?
 
Thanks. Great news. Just to make sure I understand, is the green line the best possible outcome in Fire Calc, the red line the worst, and the blue line the nominal or average?

None of the above. The Green line is Bob, the blue line is Betty and the red line is Bill. :)

The basis of the graph is found in the "real numbers" example of How FIRECalc Works, found here: FIRECalc: Why another retirement calculator?

An explanation of my plot on the graph is found in the first post on this thread.
 
Last edited:
I'll bet you're looking forward to that big leap after the 21 year mark! :cool:
 
Excellent, REWahoo! This is sure encouraging.

(Just to remind people with memories as hazy as mine, the origin/meaning of these lines is explained in the first post of this thread.)

FYI:
Shown here are the year-end balances of three identical portfolios. One starts in 1973 (red), another in 1974 (blue), and the third in 1975 (green).
 
Update:

Since there was some recent discussion of this old thread I thought I would update the graph showing where I stand after 12 years of retirement.

Note that this reflects nominal dollars - no adjustment for inflation.
Good job! are Mr & Mrs Wellesley/Wellington still in your employ?
 
Yep, I'm hoping [-]I'm not taking a dirt nap by then[/-] the two decades I'll have spent setting it up will really pay off!

:dance::dance::D: I cheated. After two decades I married and the second round came with a pension, portfolio and a farm. Plus my first two decades I had some temp work, rental RE sold and consumed not to mention SS, a small pension and of course some -heh,heh- psst Wellesley.

Yours is the better chart.

heh heh heh - I am happy to say my 'yes but' has been wrong most of the time or at least conservative the last 24 years while the 2-6%, 4% target withdrawal and stay the course manta has held up well. :cool: My shift to Target Retirement 2015 and 'few good stocks in 2006 has been successfully boring.
 
Last edited:
Yes, they are carrying 2/3 of the load for me.

Are you weighted more on the Wellesley side or the Wellington side? I too have them and often question myself if I should tilt to one side or the other or go 50/50. Right now, I'm heavier on the Wellington side.
 
Are you weighted more on the Wellesley side or the Wellington side? I too have them and often question myself if I should tilt to one side or the other or go 50/50. Right now, I'm heavier on the Wellington side.
I'm weighted towards Wellesley at a ratio of 65/35.
 
We met Mr/Mrs Wellesley/Wellington long ago. Went a different route and now have a 10 year RR at 5.6%. We enjoyed their company but said goodbye. Not sure if we fared better or worse.
 
We met Mr/Mrs Wellesley/Wellington long ago. Went a different route and now have a 10 year RR at 5.6%. We enjoyed their company but said goodbye. Not sure if we fared better or worse.

According to Vanguard the 10 year (fee adjusted) average annual return for Admiral shares of Wellesley and Wellington is 7.1% and 7.3% respectively.
 
Good job! I seem to remember one of them closed to new investors in the late 90's then we went Total Stock Market and starting mixing it up with different bond funds and REIT's and European. Have some individual stocks. You did well.
 
Back
Top Bottom