Future Stock and Bond Returns!?

nun

Thinks s/he gets paid by the post
Joined
Feb 17, 2006
Messages
4,872
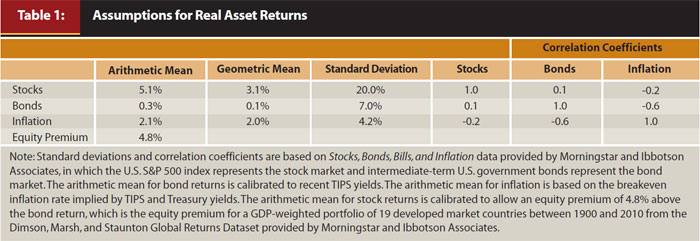
One of the critical inputs to any retirement income calculation is the size and distribution of investment returns. Some models use historical averages and standard deviations, but recently Pfau has used current intermediate US Government bond rates and then taken the premium in return from stocks that you would expect from the historical data and also uses that data to derive a distribution in returns. The paper is here and the critical numbers are given in Table 1.

FEB13-Pfau-Table-1.jpg


https://www.onefpa.org/journal/Page...Efficient Frontier for Retirement Income.aspx


This obviously predicts lower than historical average returns. Is this the best way to estimate future returns?
 
Last edited:
So if you buy into this, when filling out retirement calculators, you would set stocks at 7.2%, bonds at 2.4% and inflation at 2.1%? Not much different than 6%, 3%, 2.5% I typically use.

The graphic is not quite right..."Correlation Coefficients" should extend one more column to the left. Not that Wade's reading this or anything, lol!
 
I would take a select/ultimate approach to future returns
 
So if you buy into this, when filling out retirement calculators, you would set stocks at 7.2%, bonds at 2.4% and inflation at 2.1%? Not much different than 6%, 3%, 2.5% I typically use.

The graphic is not quite right..."Correlation Coefficients" should extend one more column to the left. Not that Wade's reading this or anything, lol!

+1

When I use firecalc, I use conservative numbers very similar to these. Better to be safe than sorry.
 
So if you buy into this, when filling out retirement calculators, you would set stocks at 7.2%, bonds at 2.4% and inflation at 2.1%? Not much different than 6%, 3%, 2.5% I typically use.

The graphic is not quite right..."Correlation Coefficients" should extend one more column to the left. Not that Wade's reading this or anything, lol!

Yes there is a small formatting error in the table. This Bogleheads wiki page perhaps points out the danger of using historical averages. I like that the expected returns are broken out into different stock classes rather than Pfau doing a lumping together of a GDP weighted international returns from a lot of countries. Of course he has to set some general parameters to have any chance of attacking the problem.

https://www.bogleheads.org/wiki/Historical_and_expected_returns
 
Last edited:
So if you buy into this, when filling out retirement calculators, you would set stocks at 7.2%, bonds at 2.4% and inflation at 2.1%? Not much different than 6%, 3%, 2.5% I typically use.

Although that is quite different for stocks?

Stocks 4.8% real vs. 3.5% real is 30% less.

I currently use 6.5% & 2.0% inflation as most likely in my models (so 4.5% real) for stocks. Bonds I don't use, CDs and savings instead, which are actually yielding in my portfolio roughly 2% (CDs 3.4%, savings 1.5%) and dropping.

For what it's worth.
 
Pfau has used current intermediate US Government bond rates and then taken the premium in return from stocks that you would expect from the historical data and also uses that data to derive a distribution in returns.

This obviously predicts lower than historical average returns. Is this the best way to estimate future returns?

There are a variety of ways to calculate expected returns that all sound plausible (and they all typically yield lower than historical returns). Is Pfau's method the best? I doubt it -- not because I think it is inherently bad but because there are lots of other methods that could just happen to be a little bit better.

I skimmed through the link and I didn't see any experimental results to show that his method is better than using say Schiller PE10 to set expected returns. This is something that can be tested on historical data (e.g., in the same way Schiller showed that PE10 is better than PE1, Pfau could show that his method > PE10). However I think there's a strong possibility that the limited data would make many comparisons inconclusive.

FYI the book I always hear referenced for expected returns is

http://www.amazon.com/Expected-Retu...qid=1357684452&camp=1789&sr=8-1&creative=9325

available as free PDF download here

http://www.cfapubs.org/toc/rf/2012/2012/1

I've not read this (it's on my todo) but suspect it might be helpful.
 
Last edited:
I use 7% real overall, but higher for small,mid-cap, emerg. Why, because i accept the data. Underestimating is just as dangerous as over.


Sent from my iPhone using Early Retirement Forum
 
I use 7% real overall, but higher for small,mid-cap, emerg. Why, because i accept the data. Underestimating is just as dangerous as over.

Just curious why underestimating would be dangerous?
 
I use 7% real overall, but higher for small,mid-cap, emerg. Why, because i accept the data. Underestimating is just as dangerous as over.


Sent from my iPhone using Early Retirement Forum

Everyone's working with similar data, but it's how its weighted and analyzed that matters.
 
So if you buy into this, when filling out retirement calculators, you would set stocks at 7.2%, bonds at 2.4% and inflation at 2.1%? Not much different than 6%, 3%, 2.5% I typically use.

The graphic is not quite right..."Correlation Coefficients" should extend one more column to the left. Not that Wade's reading this or anything, lol!
I use 6%, 2% and 3% and I am concerned that 3% for my personal inflation rate is too low for my situation and where we live. Inflation is local.

Geometric means.
 
What period of time is this prediction covering? 10 years, 20 years, ... ?

BTW, 10 year TIPs are at 0.6%.
 
Last edited:
Back
Top Bottom