How hard is it to RE at the market top (2014)?

If my observations are close, we 'risk takers' may be taking a more conservative withdraw method than you are in counting on at least 0% real return from conservative investments?

Over time, odds are you will make much more money. I am okay with not making a lot more money than I have today, in inflation adjusted dollars. The pain of losing 50% of our portfolio would hurt more than making another 300%, which we probably wouldn't spend anyway. Technically I believe this is called diminishing marginal utility (marginal desirability of money decreasing as it it accumulated).

The Fidelity RIP shows that we will have more in inflation adjusted dollars at age 100 than we have today with a conservative portfolio. We've looked at that and said good enough. We'd rather do that than risk losing half our life savings in one year due to a market correction, especially early on in retirement. I feel like I am buying peace of mind to not have to worry about the day to day or year to year happenings in the stock market for the next 40 years.

I think Bill Berstain called this why keep playing when you've won the game. YMMV.
 
I wonder if there might be some overthinking going on here...

[FONT=&quot]Isn't that what we do here?

I attended a webinar today that Wade Pfau presented regarding his safe savings rate work. An aside: It was interesting hearing him say that he considered his career to be a success now that he's been published in The Economist.

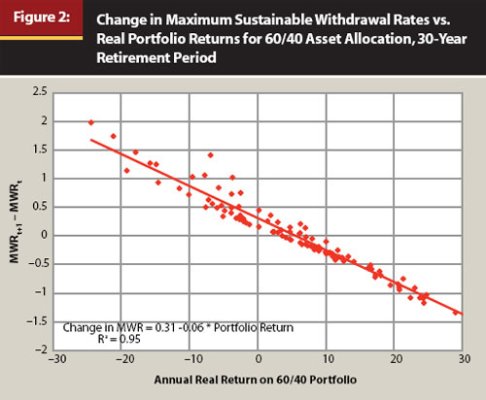
Now back to the subject - although it didn't specifically talk about the topic of this thread he did discuss on the of the graphs from the paper that I do think is relevant. It related "next year's" SWR to market (60/40) return. The correlation was high and was an interesting look at the historical change is successful SWR after a above or below average market returns. He also talked about the "target" number method and how it can be deceiving (high or low) depending on market performance close to retirement.

In an indirect way it touched on retiring after a high or low return environment and the expected change in SWR that you should expect (based on historical of course). It's what one might expect, but it puts some numbers to it.

The text from the paper (below) and the graph (attached):

"[/FONT]Figure 2 shows a very close relationship in which the MWR tends to fall after a year with high real portfolio returns and rises after negative returns. The figure plots annual real returns on a 60/40 portfolio against the percentage point change to the MWR for a new retiree in the next year. The fitted regression line shows that on average, the MWR falls in years that real portfolio returns exceed 5.6 percent.[FONT=&quot] "
[/FONT]
 

Attachments

  • pfau.jpg
    pfau.jpg
    38.3 KB · Views: 9
I think people who argue for higher allocations to price-variable assets, usually where at least part of the return is expected to come from selling appreciated securities, are those who are comfortable with statistical thinking. Statistical thinking is very nice, however we may forget that this derives from the law of large numbers, while each of us one person living his one life. And even Firecalc is based on a very flimsy data set. Just running through a 60 year sequence in 30 different trips with 30 different beginning and ending periods, in no way creates 30 independent trials. ( same principle holds with the longer history accessed by Firecalc)...

Absolutely - in fact, I was doing some digging today, and it looks like 7 of the 8 worst periods are ALL due to the 1974 market drop followed by low real returns (high inflation). The 8th was 1906. So really only two different profiles of failure modes - not much to draw general rules from.

But I don't know what we can do really. It's why I'm conservative enough to go for 100% and as long a period as I can enter (~ 45 years before 1966 drops off the data set), and that takes me past all but the most extreme life expectancy. So while I can't count on this being enough data to provide any real assurances of success, I also can't see taking a WR that has been known to fail in the past.


Much more of this is luck than we care to admit. This is one reason why I am puzzled when I hear people reject taking SS at 70, because Firecalc gives them a "better" result when starting at some earlier age, and therefore getting a smaller monthly check.

I agree on this as well. There are statistics, and then there are the things that just make sense to provide protections. Delaying SS is one, especially if it provides added security for a spouse.

I have invested assets =~50x my pending needs. This does not include much travel or unusual medical expenses, but neither does it involve clipping coupons or doing without anything that I want. If I do certain things it will cost me more. But I own my home, eat as well as I want, etc. Nevertheless, feeling unsinkable I believe would be as misguided as it was for those who boarded the Titanic in April of 1912.

Ha

Our thinking convergences - Once we are taking pensions and SS, I'll be at 2% or maybe even less. I'll only be in the 3-4% WR range for a few years between DW fully retiring and us starting to collect some of the pensions/SS. And of course, my expenses may increase in unpredictable ways. Too many unknowns to call it unsinkable, but you've got to pull away from the dock sometime.

-ERD50
 
I do have a low 6-figure in I-bonds, but not TIPS. The latter is more complex and can be traded in the after-market. I have not owned any, same as individual corporates or munis.

What year specifically did you use, I may run some variations on that? 1966 seems to keep coming up as the killer year.

I only looked at the ensemble, and did not try to pinpoint the exact years. If one sets WR to 0 and looks for a starting year that resulted in a low value after 5 years, he will find 1915, 1975, 1976, and 1977. So, my earlier comment about the Vietnam War era was wrong. It was the post-Vietnam and oil crisis period.
 
In a past post, daylatedollarshort talked about being heavily in TIPS. I do not follow it nor have any, so do not know what the yield is, or how it has been doing recently.

I sold most of the TIPS when interest rates bottomed out. The gains were like 20 - 40% so I could not see giving that up as interest rates rose. We are DCAing back in now.

We just have a conservative tilting hodge podge right now of CDs, TIPS, I bonds, short term bond fund, stocks, etc. We have three stable value funds in various 401Ks.

I don't have a lot of I bonds right now due to cash flow reasons. But we do have about 9 tax ids between all the family members, businesses, trust, tax refund, etc. to potentially purchase more in the future.
 
Last edited:
Originally Posted by ERD50 View Post
If my observations are close, we 'risk takers' may be taking a more conservative withdraw method than you are in counting on at least 0% real return from conservative investments?
Over time, odds are you will make much more money.

But you see, none of my posts were about 'making more money'. It was about what will provide protection in the historically worst periods of time. For me, that is the true definition of being 'conservative' - having a plan that has passed previous tests.

Now, it's true that higher equities provide more cases of higher ending portfolios, but I care far more about not running out over our joint lifetimes than I do about how much excess we die with. That's why I didn't have one word of it in my earlier posts.


The pain of losing 50% of our portfolio would hurt more than making another 300%, which we probably wouldn't spend anyway. Technically I believe this is called diminishing marginal utility (marginal desirability of money decreasing as it it accumulated).

But history has shown you can lose all of your portfolio to inflation (a fail scenario) if it is too 'conservative'. It doesn't happen in a year or two, but that doesn't matter to me - I'm in this for the long run, it is the long run I'm concerned about. Again, I don't care about the 300% I might gain - I'm talking strictly about protection under bad scenarios.

A 50% loss is a 50% loss, regardless if it is due to inflation, the market, or a combination. I want to limit my losses, and everything I've been able to get my hands on tells me that a 50-80% equity position is the most likely way to limit my long term losses (in real dollars).

Don't get me wrong - I'm not trying to talk you out of anything. Your plan may be well thought out and totally appropriate for you. I just have a problem when people start implying that a 'conservative' plan is less risky over the long run. History shows you need to accept some 'volatility risk' in order to gain long term security. I haven't seen anything to counter that, except for maybe some annuities under some circumstances, but those have other issues.

-ERD50
 
I should have worked for a company that offered good pension. That would have removed significant part of risk in RE. Pension + SS + n% WR sound good.
 
I should have worked for a company that offered good pension. That would have removed significant part of risk in RE. Pension + SS + n% WR sound good.

On the plus side, your SS will be based on your Bay Area salary years no matter where you live in retirement, plus you can probably cash out of your house for a lower cost of living place if you wanted to.
 
I only looked at the ensemble, and did not try to pinpoint the exact years. If one sets WR to 0 and looks for a starting year that resulted in a low value after 5 years, he will find 1915, 1975, 1976, and 1977. So, my earlier comment about the Vietnam War era was wrong. It was the post-Vietnam and oil crisis period.

I forgot to mention something else that might be overlooked. That is the starting year that resulted in the lowest portfolio after 5 years was not necessarily the starting year that resulted in the lowest value after 10 years, 15, or 20, etc...

We just have a conservative tilting hodge podge right now of CDs, TIPS, I bonds, short term bond fund, stocks, etc. We have three stable value funds in various 401Ks...

I perfectly understand the philosophy of playing it safe, knowing that one gives up some potential returns. In fields such as game theory and optimal control, people talk of the Minimax strategy, which seeks to maximize the worst possible outcome.

Most people talk of doing the above by tweaking WR or AA. You talk about using other investment vehicles. That is fine, but how does one go about evaluating different strategies? Note that there is always a trade-off between WR and the lowest portfolio value during the retirement period. If one prefers a method that seems inherently safe but provides a really low WR, then how does that compare with another that has more volatility but gives a higher WR? I can take a 100% stock portfolio and if my WR is 0, I can be sure that it can never go to 0.
 
Last edited:
Don't get me wrong - I'm not trying to talk you out of anything. Your plan may be well thought out and totally appropriate for you. I just have a problem when people start implying that a 'conservative' plan is less risky over the long run. History shows you need to accept some 'volatility risk' in order to gain long term security. I haven't seen anything to counter that, except for maybe some annuities under some circumstances, but those have other issues.

-ERD50

I have used our current AA and also the conservative portfolio option in the Fidelity RIP and we are still increasing our net worth in inflation adjusted dollars at age 100+. We just try to focus more on low spending and sustainable living than playing the odds for good stock market returns.
 
Much more of this is luck than we care to admit. This is one reason why I am puzzled when I hear people reject taking SS at 70, because Firecalc gives them a "better" result when starting at some earlier age, and therefore getting a smaller monthly check.

I agree 100% with your statement that I highlighted above, but not with the rest of the paragraph.

As mentioned in an earlier post in this thread, I played 3 SS scenarios (62, FRA, and 70) in FIRECalc and saw only a bit of difference between the 3. But then as you said, that is an a priori statistical result, most useful when we do not have any other data.

When I get to 62, the 1st chance that I can claim SS, I will evaluate the situation then. Delaying SS will get me 8% increase each year, but if we will have been in a bad recession, I will have to draw more out of my stash, and my precious cash may have a better chance of returning more than 8% during the subsequent economic recovery. So, I will draw SS early if the market is bad, and may bank it if I am flush. If the market has been doing well, the chance of it to keep returning 8% or more to beat delaying SS is not going to be high, so I will spend my stash first. In other words, I will use SS as a hedge.

Until I get there, these are just scenarios to play in my mind and then I do not spend much time with it really.
 
Last edited:
...
The reason that "you don't need to re-adjust after a market drop", is because that value was historically safe in every single cycle. Every one. So no, you "you don't need to re-adjust after a market drop", because that market drop is just one of the squiggly lines on the output chart that dips and rises and passes with a 100% historically safe WR - without re-adjustment.

How can it be otherwise?
...
-ERD50

[FONT=&quot]
...
The text from the paper (below) and the graph (attached):

"[/FONT]Figure 2 shows a very close relationship in which the MWR tends to fall after a year with high real portfolio returns and rises after negative returns. The figure plots annual real returns on a 60/40 portfolio against the percentage point change to the MWR for a new retiree in the next year. The fitted regression line shows that on average, the MWR falls in years that real portfolio returns exceed 5.6 percent.[FONT=&quot] "
[/FONT]

Interesting plot. Don't know what withdrawal rate they based their calculations, but if you use something around 5% recalculating the withdrawal each year gives almost the same dollar withdrawal rate each year as with no re-calculation.

I think this chart tends to confirm that ERD50's analysis is correct and that recalculation is unnecessary.
 
When I get to 62, the 1st chance that I can claim SS, I will evaluate the situation then. Delaying SS will get me 8% increase each year, but if we will have been in a bad recession, I will have to draw more out of my stash, and my precious cash may have a better chance of returning more than 8% during the subsequent economic recovery. So, I will draw SS early if the market is bad, and may bank it if I am flush. If the market has been doing well, the chance of it to keep returning 8% or more to beat delaying SS is not going to be high. In other words, I will use SS as a hedge.

Until I get there, these are just scenarios to play in my mind and then I do not spend much time with it really.

This almost exactly describes my situation. I don't really think too much about it since I'm not 62 yet. Even at 62, if I decide to wait, I can always change my mind and start drawing if conditions warrant.

For the moment, running Firecalc I have it default to me taking it when I'm about 62 1/2 (that is Firecalc runs from the start of the year so I have it as me taking SS in the year that I will turn 63).

But, what I will really do, will just depend on the what is going on when I become eligible.
 
Yes. But playing with FIRECalc in advance shows me that I get covered either way. Heh heh heh...
 
Yes. But playing with FIRECalc in advance shows me that I get covered either way. Heh heh heh...

I have run it both ways in Firecalc. A couple of years ago it favored me slightly taking it earlier. Now, it favors me slightly taking it later. But, it isn't a huge difference either way.
 
I have used our current AA and also the conservative portfolio option in the Fidelity RIP and we are still increasing our net worth in inflation adjusted dollars at age 100+. We just try to focus more on low spending and sustainable living than playing the odds for good stock market returns.

My point is that we are all 'playing the odds'. And the odds show that 'conservative' AA's fail more often than more balanced portfolios. Even when the stock market has taken a dive, those same stocks have helped save the portfolio over the long run. Someone investing with a very low equity allocation is 'playing the odds' that inflation and low returns won't eat up their portfolio worse than the person with a higher equity allocation. And those have historically been the worse odds to take.

Now, a lower WR% helps in all cases. And if your WR is low enough, investment style may not much matter. But that doesn't change the issue of how different AA's have performed in the past.

Fidelity RIP uses Monte Carlo analysis, and I'm not a fan of that for this sort of study. Does it include the kinds of risks a 1964-1969 retiree would have seen, from the sequence of markets and inflation?

Have you entered your numbers in a historical reporter like FIRECalc out past age 100?

-ERD50
 
Have you entered your numbers in a historical reporter like FIRECalc out past age 100?

-ERD50

ERD50, With our baseline retirement expenses, we are still saving money in retirement. I tried to run the RIP for you to age 200 at our current AA (conservative equivalent), but I could only go to 125. And we have a larger portfolio then in today's dollars than we do now or age 100.

I just use RIP and my own spreadsheets with a 0 - 1 percent real options because we can get that with TIPS and I bonds and probably other investments. Real interest rates have historically had positive returns and I don't think longer term TIPS and I bonds have ever gone below 0 real.

I don't use Firecalc due to my Mary and Joe example earlier in this thread, plus it doesn't have taxes or RMD features, it doesn't have a TIPS option and I don't really know who wrote it, what quality assurance testing it has gone through or why I should trust the calculations in it to be correct.

I have validated many of the numbers in the Fidelity RIP detailed income summary against my own spreadsheet including RMDs and taxes, and they come out pretty close.
 
Last edited:
ERD50, With our baseline retirement expenses, we are still saving money in retirement. I tried to run the RIP for you to age 200 at our current AA (conservative equivalent), but I could only go to 125. And we have a larger portfolio then in today's dollars than we do now or age 100.

Congratulations, you fall under the “you have won, why risk your funds” category, sweet.

I noticed earlier you posted about fearing a 50% loss much more than enjoying a 300% gain, not to worry with your chosen path. This phantom boogie man still lurks for me. One has to purposely take action, selling off the depressed equities portion of the portfolio, in order to realize the loss. I hope for the resolve to not do this, and to instead welcome the buying opportunity.
 
Last edited:
... I tried to run the RIP for you to age 200 at our current AA (conservative equivalent), but I could only go to 125.

I only asked about running FIRECalc to age 100+ as you said you did that in RIP. I wonder if the Monte Carlo in RIP tests against a period of high inflation after a market downturn, as FIRECalc does (1966)? Don't go past ~ 45 years in FIRECalc, or you will start dropping off the bad periods in the late 1960's.

I don't use Firecalc due to my Mary and Joe example earlier in this thread,

Your call of course, but that isn't really a reason not to use FIRECalc, it is an issue with the understanding of how FIRECalc works - and it is a little tough to get your head around.


... plus it doesn't have taxes or RMD features, it doesn't have a TIPS option ...

Taxes are a tough call, due to future changes and all, I can see why some calculators have you consider that externally as an 'expense'. But you have to do something, if you can trust their rules that would be a plus. RMD can affect taxes, but otherwise not the portfolio success.

TIPS - that could be worthwhile, I think I'll make a feature request.

... and I don't really know who wrote it, what quality assurance testing it has gone through or why I should trust the calculations in it to be correct. ...

What do we know of RIP in this regard? In FIRECalc, I can at least check simple profiles against published materials, make changes a step at a time and see if the changes add up.

I don't know how to validate Monte Carlo. What std devs did they use? Why? Do they do any correlations between parameters? Are there timing constraints, slope constraints, etc? And so on.

I have validated many of the numbers in the Fidelity RIP detailed income summary against my own spreadsheet including RMDs and taxes, and they come out pretty close.

How do you validate against a randomized output?


-ERD50
 
Congratulations, you fall under the “you have won, why risk your funds” category, sweet.

I noticed earlier you posted about fearing a 50% loss much more than enjoying a 300% gain, not to worry with your chosen path. This phantom boogie man still lurks for me. One has to purposely take action, selling off the depressed equities portion of the portfolio, in order to realize the loss. I hope for the resolve to not do this, and to instead welcome the buying opportunity.

We don't have a zillion dollar portfolio or huge pensions like some of the other posters here. We are just trying to find ways to keep our retirement expenses low.
 
Your RIP results are much better than mine! As a newbie I appreciate the insights presented in the forum discussions.

Risk and Time is a web page I stumbled onto the other day.
 
Last edited:
Let me take a stab at this one - I kind of disagree with the path of some of the other explanations, though I see where they are coming from -
Joe retires in 2016, with $1M and a planned 4% SWR for 30 years with a 94% rate and 75/25 stock bond mix.

In 2017, the market crashes. Joe's portfolio drops 40% to $600,000. Mary wants to retire in 2017 for 29 years with a portfolio of $600,000, and a 75/25 mix and a 4% SWR, but Firecalc says she only has a 43% chance of success.

First, I believe you misstated the problem. I assume you mean that Mary wants to withdraw the same (inflation adjusted) amount as Joe, not 4% of the portfolio? A 4% WR has the same success rate regardless of the amount of the portfolio (all else being equal - AA, etc) - it's a percentage.

If so, let's clear that up and restate this. Also, I find it easier to describe with a 100% historic success rate, then we can just address WR% to maintain that 100%, it's just a binary pass/fail:

Joe retires in 2016 with a $1M portfolio, 75/25 AA and plans to draw an inflation adjusted $35,900 annually - FIRECalc reports a 100% historical success rate.

In 2017, the market crashes. Joe's portfolio drops 40% to $600,000. Mary wants to retire in 2017 for 29 years and plans to draw an inflation adjusted $35,900 annually (I'll skip the adjustment for 29 versus 30 years, it's not important). Her portfolio is now $600,000, same as Joe's.


OK, two things to consider:

1) Joe and Mary would have both had $1M in 2016 (not accounting for the one year withdraw affect). So they are both essentially equally wealthy. IMO, the explanation on the FIRECalc page with the 3 retirees in 1973,74,75 obfuscates this, as it shows them all retiring with the same $ amount after the market has changed - but that means they were unequally wealthy in 1973, so you really can't compare them equally.

2) Here is where FIRECalc is simplistic - but that's OK once you understand it. It doesn't know where in a market cycle you are (but neither do Monte Carlo calculators), it does just as it says, no more - it looks at you how you would have fared with that amount at each cycle in its history, and presents a historic success rate. Let's investigate this.

OK, it's easier to think in terms of history, since that is all FIRECalc does, so instead of saying Joe retires in 2016, let's say we are looking at his retirement on one of the past paths in FIRECalc history, like the 1960's - then we won't be trying to guess the future. So just as in your example, let's say that path shows a drop in his buying power from $1M to $600,000 in the first year. So he was drawing $35,900 the first year (3.59%), let's also assume no inflation this year for simple numbers. So his second year he is drawing the $35,900 on a $600,000 portfolio, and that's a 5.98% WR.

But that's OK - it is what happens as the portfolio dips and rises, the WR% changes. But we know that historically this initial 3.59% WR succeeded, so if the portfolio dropped, this newer higher % WR also passed. It would follow one of those squiggly lines, but never drop to zero before year 30 in the cycle, and the WR% would vary along the way.

What this means is that if Mary retired on year two of Joe's path, she had $1M the previous year and could have drawn the same $35,900 - but she didn't (and lets ignore any additions if she is still working). But now in year two her portfolio is down like Joe's and yes, she can draw $35,900 at 5.98% WR, and she will succeed just as Joe will.

So after that linear description, a more concise way to think about this is that FIRECalc reports the worst case. That 3.59% WR will fare far better than just a 'pass' in most paths (see the min/max averages for that). So you don't need to adjust for a 'bad time to retire' - FIRECalc already reported on the worst times to retire, the rest are gravy. And that is why Mary can retire with a 5.98% WR. It is not irrational - she had $1M before she had $600,000, so she really is just one year into taking 3.59% of $1M - just like Joe. Get it?

What this means for all of us: With the obvious caveat that the future may be worse than the worst of the past.... I read this a while back on a bogleheads thread, I forget the poster now, but he was stating that if you go with the 100% success WR%, you can 'reset' your 'spend' amount to a higher level (@ 3.59%) at each peak in your portfolio. Now I know how scary that sounds, but if you think about it, that is exactly what FIRECalc is reporting when it gives you a 100% success WR% - it passed no matter where you were on the path. The (inflation adjusted) market peaks are associated with the lowest safe WR%, so if they are safe at the peaks, they are safe period (in the data-set).

Now, if we only knew the future. ;)

-ERD50
 
What do we know of RIP in this regard? In FIRECalc, I can at least check simple profiles against published materials, make changes a step at a time and see if the changes add up.

I don't know how to validate Monte Carlo. What std devs did they use? Why? Do they do any correlations between parameters? Are there timing constraints, slope constraints, etc? And so on.

How do you validate against a randomized output?


-ERD50

I validated some of their tax numbers and ballpark ending amounts for a conservative portfolio with a 0 - 2% real return in my spreadsheets. You can usually get at least 1% real with longer term TIPS even with current low rates, and historically that has been more like 2%.

I don't really know anything about slope constraints. I am not really interested. We're more interested in capital preservation. Historically 0 - 1% is not a fantastically high bar to try to achieve so I don't lose a lot of sleep over it. We spend more time on controlling our expenses and generating passive business income.

I have read Zvi Bodie's books and articles. DH and I have discussed his investing style and decided it works for us. YMMV.
 
I don't really know anything about slope constraints. I am not really interested.

Well, if most of your portfolio is in TIPS, and COLA'd pensions and SS make up the rest of your income, then I see your point - the Monte Carlo factors are not a concern - you can do straight-line math in a fairly simple spreadsheet, the inflation factors are a wash.


We're more interested in capital preservation.
I think we all are. I guess I'm just trying to put this in perspective. I'd say most people here who will need to rely on their portfolios for a significant portion of their future income, probably grew it by having a reasonably aggressive AA. Now I can see the value of diversifying that into TIPS, but it's a tough call to make on when to sell the market and also get decent rates on TIPS.

It's something I'll think about though, and this thread has helped open my eyes to that.

-ERD50
Without portfolio income I would be completely screwed, at least wrt having more than a very bare bones life. I try to be frugal, but when the salmon runs start, or when the halibut shows up in spring, I am going to be buying and eating them. Likewise decent wine, decent brandy, some gifts for my love, going out to enjoy some jazz. So I cannot treat my portfolio as nothing but gravy- nice to have but actually unneeded.

As I remember, when I quit working the SS tax max income was only about 1/5 of my income. You add a very long string of zeroes to that, and you had better have portfolio income!

Ha
 
Last edited:
Back
Top Bottom