I now have Firecalc lite in my spreadsheet

corn18

Thinks s/he gets paid by the post
Joined
Aug 30, 2015
Messages
1,890
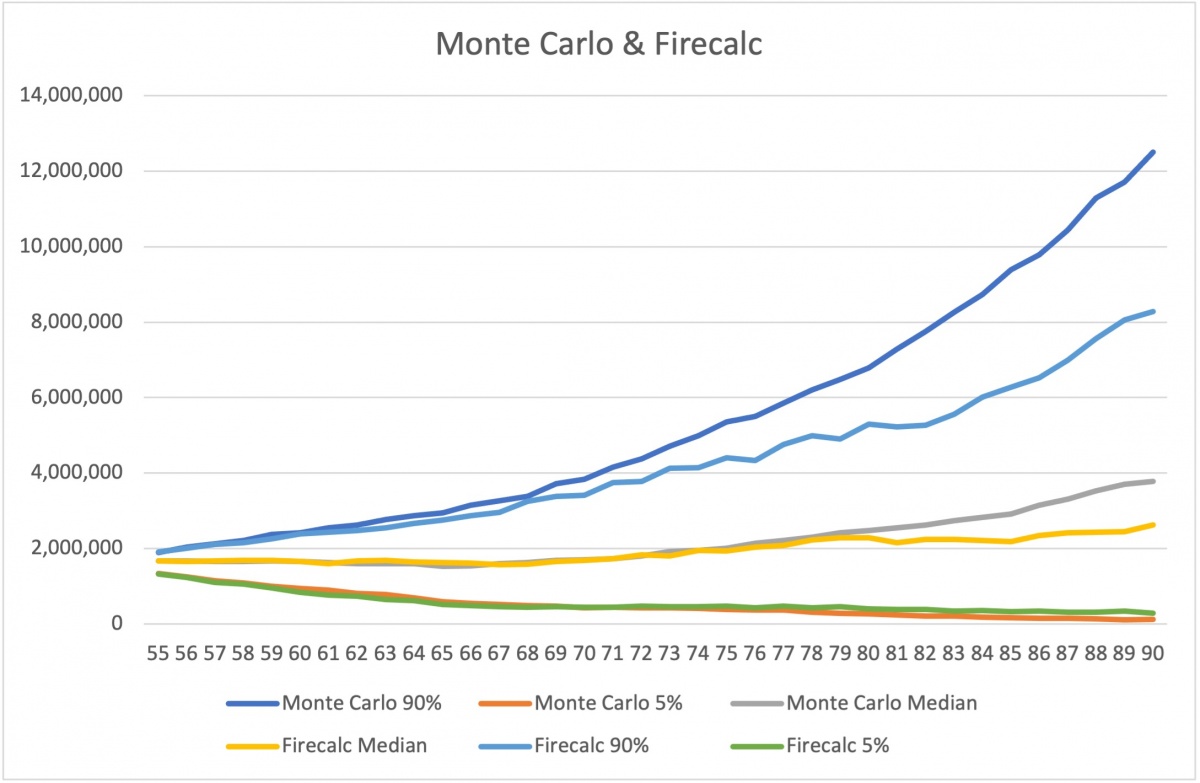
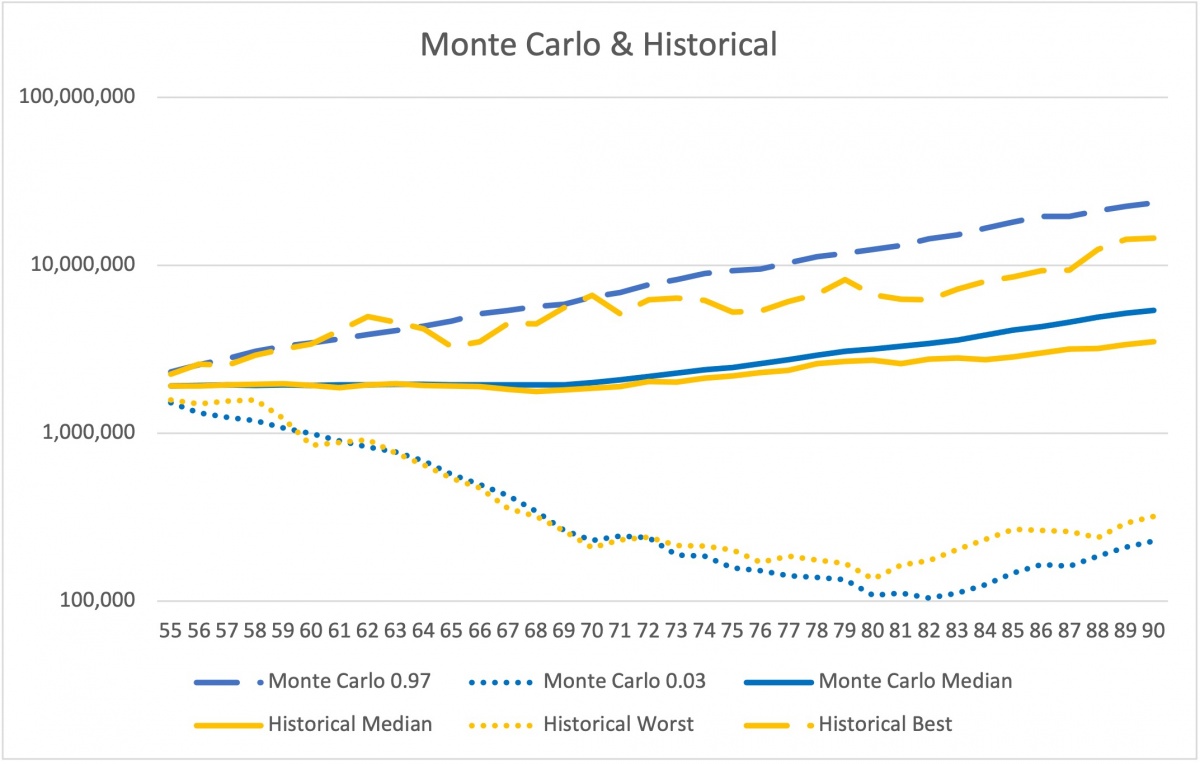
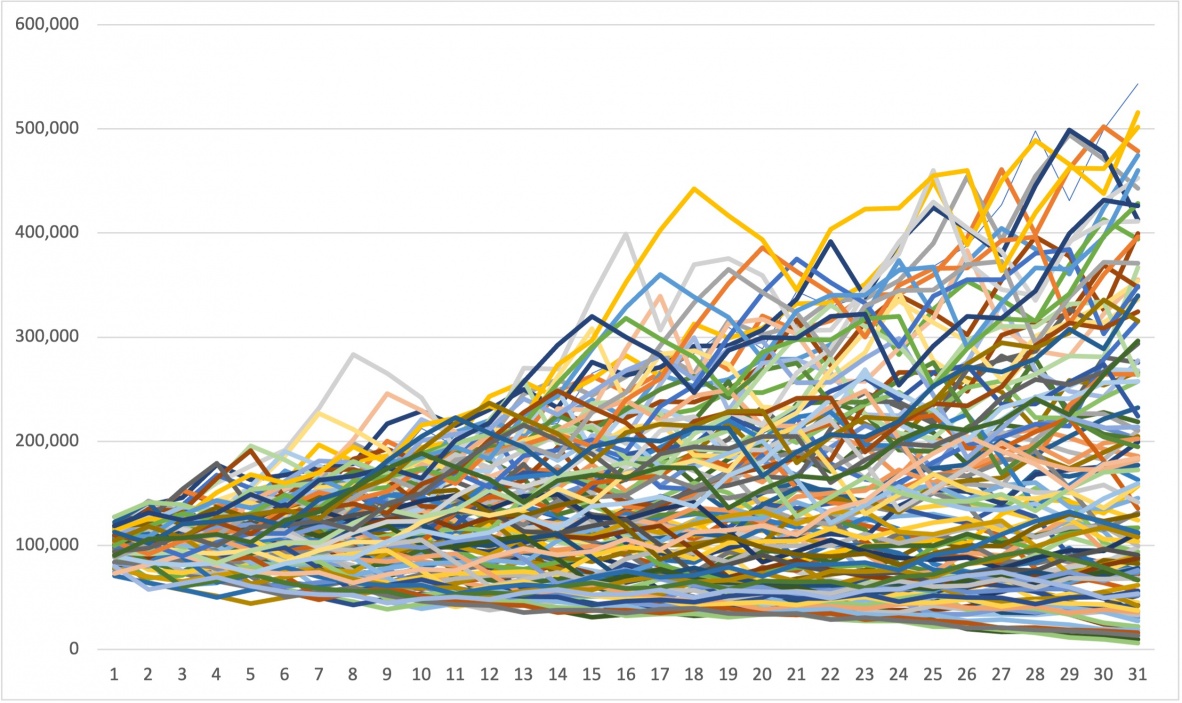
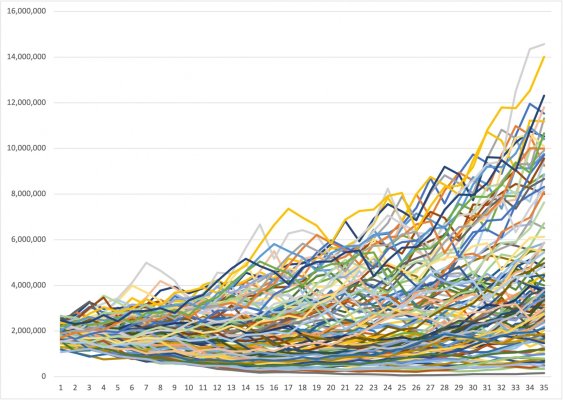
I incorporated historical returns from 1871 to 2020 into my spreadsheet so I could see what happens for different start years. I got tired of entering dates a year at a time, so I went full bore and calculated my balance for 115 different start periods like firecalc. I ran a simple test case against firecalc of $100,000 starting balance w/ $4,000 withdrawals. Then spent the next 2 hours trying to figure out why my model and firecalc were off a bit (1%). Turns out firecalc is much more complicated than simple real returns. I downloaded the one year firecalc spreadsheet and there is a lot going on. For now, I'm not going to fix that 1% because it is very complex.

What I have now is the ability to spit out my 115 lines directly from my spreadsheet. And it spits out the worst year for me so I can plug that into my model to look at the single year. And it spits out a Ps. This make me very happy because now I can easily see all my what if's without having to bounce back and forth to firecalc.

Life is good. 100% Ps. 61 days and a wakeup.
 

Attachments

  • retirment.jpg
    retirment.jpg
    511.8 KB · Views: 183
Last edited:
And now I have a Monte Carlo sim in my spreadsheet. Matches the Flexible Retirement Planner (FRP) exactly. I have it doing 1319 runs right now. That should do for now.

Interesting to see the Ps from firecalc and Ps from the FRP side by side in real time as I change my inputs. They match pretty well except when I get to corner cases in AA. 0/100 and 100/0 do very poorly when you use actual returns like firecalc does. Monte Carlo is much more optimistic.
 
Last edited:
^ That is very interesting!
 
Now that I have firecalc and a Monte Carlo sim in my spreadsheet, I can have some fun with comparing the two. I use my data for a 60/40 portfolio. I decided to compare the median, 90% and 5% outputs from firecalc and the MC. Here's what came out:

35183-albums227-picture2330.jpg


Fascinating how closely they track for a while. The 5% line is perfect. The median diverges towards the end. The 90% line only holds on for a bit.

Ps for firecalc is 99.1% and for MC is 95.8%. I have 115 runs for firecalc and 1,319 for the MC. I love data!
 
Since you seem to enjoy playing w/ the data, might want to compare your MC results to the Fido tool, which provides results for good market returns, average market returns and crappy.
 
In general, I would expect MC results to be more conservative.
 
I made a generic version of my retirement spreadsheet to see if others could use it. It incorporates firecalc and Monte Carlo. There is also a tax section, but that is so complex I can't figure out how to make it useful. It does have the SS worksheet in it if you want to DIY.

Let me know if the link works and any feedback.

https://drive.google.com/file/d/1DkCsMpZCQMnxYH3jkHR1I81llDYpn7ZT/view?usp=sharing
 
In general, I would expect MC results to be more conservative.

I would expect MC to be more conservative on the low end, but I would expect it to be more optimistic on the high end (as Corn's results are).

MC has the well-known problem of fat tails -- in MC, you can get a 1929-style-return 5x in a row, OR a 1958-style return 5x in a row. In actual market history, that rarely (never) happens.
 
Some interesting findings.

I have found the Monte Carlo (MC) tail:

35183-albums227-picture2337.jpg


MC is better on the good side and worse on the bad side vs historical. Even at the mean, MC gets a tail. I know why that is, but it was cool to see it pop out of my model.

Here's something else I found interesting:

35183-albums227-picture2336.jpg


This is 0% real returns vs. bottom 3% from MC vs. worst from historical (which is also my plan). Damn good correlation (this is on a blown up log scale).

This only works for my situation. This diverges wildly if you put in 0/100 for an AA. That's because nothing that MC can come up with is as bad as historical returns when you are 0/100. MC does ok at the 100/0 end, though.
 
Last edited:
Another interesting experiment.

This is the output from historical returns for a 30 year retirement starting with $100k withdrawing 4%. Sounds familiar? Ps is 100% for this scenario:

35183-albums227-picture2338.jpg


Look familiar? Looking at this, I am happy. 100% Ps and many lines that get bigger.

Now look at this:

35183-albums227-picture2339.jpg


It's the worst line pulled out of all those better lines. This is what I use as the main input to my model. Even though I am @ 100% Ps, the output chart for worst case still scares the crap out of me.

If you want the real returns for a 60/40 portfolio for the worst starting date (1969), I pasted them below. You can use those to make your own haunting chart.

1969 -12.44%
1970 1.76%
1971 10.77%
1972 8.32%
1973 -16.97%
1974 -23.67%
1975 18.07%
1976 16.47%
1977 -6.67%
1978 -2.70%
1979 2.44%
1980 7.75%
1981 -8.00%
1982 19.64%
1983 13.08%
1984 3.74%
1985 23.63%
1986 14.46%
1987 -2.37%
1988 8.87%
1989 17.47%
1990 -6.01%
1991 22.83%
1992 5.16%
1993 7.30%
1994 -3.74%
1995 25.56%
1996 10.34%
1997 20.33%
1998 15.53%
1999 11.00%
 
Last edited:
And now I have a Monte Carlo sim in my spreadsheet. Matches the Flexible Retirement Planner (FRP) exactly.

I have no experience with spreadsheets, but use Flexible Retirement Planner regularly, with an occasional second opinion with FireCalc. I generally find FireCalc tends to be a bit more optimistic, maybe because I can't define as many financial details. I prefer to err on the side of caution, and like being able to save all my values within the program, so I use FRP the most.

They're all just educated guesses, but I would rather plan for the worst case and have things turn out better, than have things turn out worse than I expected.
 
I have settled on FRP also. Different tools for different folks.

I love FRP. You can do a lot more detailed planning than firecalc and it can be saved, so you don't have to re-enter the data every time. But it is a Monte Carlo sim, so you just need to be aware of what that means.

I love having all the different models in my spreadsheet now. Not that it really. matters because come 31 Mar, I am done. But it's fun to see what effect taking SS early has on firecalc and FRP instantly. Or if I die @ 78, or 56 or whatever. All those what if's can now be done and analyzed with ease.

Before I had all this done, I used FRP as my goto, though.
 
I would expect MC to be more conservative on the low end, but I would expect it to be more optimistic on the high end (as Corn's results are).

MC has the well-known problem of fat tails -- in MC, you can get a 1929-style-return 5x in a row, OR a 1958-style return 5x in a row. In actual market history, that rarely (never) happens.

Agree, was just thinking on the conservative side.
 
I have no experience with spreadsheets, but use Flexible Retirement Planner regularly, with an occasional second opinion with FireCalc. I generally find FireCalc tends to be a bit more optimistic, maybe because I can't define as many financial details. I prefer to err on the side of caution, and like being able to save all my values within the program, so I use FRP the most.

They're all just educated guesses, but I would rather plan for the worst case and have things turn out better, than have things turn out worse than I expected.

The Fidelity program also tends to be more conservative than Firecalc.
 
Another interesting experiment.

This is the output from historical returns for a 30 year retirement starting with $100k withdrawing 4%. Sounds familiar? Ps is 100% for this scenario:

35183-albums227-picture2338.jpg


Look familiar? Looking at this, I am happy. 100% Ps and many lines that get bigger.

Now look at this:

35183-albums227-picture2339.jpg


It's the worst line pulled out of all those better lines. This is what I use as the main input to my model. Even though I am @ 100% Ps, the output chart for worst case still scares the crap out of me.

If you want the real returns for a 60/40 portfolio for the worst starting date (1969), I pasted them below. You can use those to make your own haunting chart.

1969 -12.44%
1970 1.76%
1971 10.77%
1972 8.32%
1973 -16.97%
1974 -23.67%
1975 18.07%
1976 16.47%
1977 -6.67%
1978 -2.70%
1979 2.44%
1980 7.75%
1981 -8.00%
1982 19.64%
1983 13.08%
1984 3.74%
1985 23.63%
1986 14.46%
1987 -2.37%
1988 8.87%
1989 17.47%
1990 -6.01%
1991 22.83%
1992 5.16%
1993 7.30%
1994 -3.74%
1995 25.56%
1996 10.34%
1997 20.33%
1998 15.53%
1999 11.00%

So 1969 was a worse starting year than 1966?
 
So 1969 was a worse starting year than 1966?

It depends. It is for my particular case. I have the spreadsheet show me the worst and best years. As I change things, the worst and best years change. But I seem to have landed on 1969 for my base case. 100/0 is absolutely 1929. 0/100 seems to land on 1941 a lot of the time. Anything in between changes the best and worst years.

Best year to start for me is 1921 unless I go from 60/40 to 50/50, then it's 1984. I am tempted to go to 50/50 just so 1984 is the best year because that's when I graduated high school. :LOL: ;)
 
I love FRP. You can do a lot more detailed planning than firecalc and it can be saved, so you don't have to re-enter the data every time. But it is a Monte Carlo sim, so you just need to be aware of what that means.

I love having all the different models in my spreadsheet now. Not that it really. matters because come 31 Mar, I am done. But it's fun to see what effect taking SS early has on firecalc and FRP instantly. Or if I die @ 78, or 56 or whatever. All those what if's can now be done and analyzed with ease.

Before I had all this done, I used FRP as my goto, though.
I'm further down the road. My choices have all been made. So the spinning wheel is not as fascinating as it once was. But FRP has interesting options like sensitivity analysis for instance.

BTW, your spreadsheet has external data link I could not access.
 
I'm further down the road. My choices have all been made. So the spinning wheel is not as fascinating as it once was. But FRP has interesting options like sensitivity analysis for instance.

BTW, your spreadsheet has external data link I could not access.

Dangit. Let me take a look and see what I'm doing wrong.
 
I think my new goal is to pay $1M in taxes over the next 35 years.
 
I have been playing around a lot with my model and the more I do, the more the Monte Carlo tail irritates me. If anyone is thinking about retiring and are trying to get to 100% in a Monte Carlo sim, you are going to work longer than you have to. From what I have found, I can get 100% in firecalc and Monte Carlo is always around 97%. And to get that last 3% in Monte Carlo requires a LOT more money. Firecalc 100% is a good target.
 
I have been playing around a lot with my model and the more I do, the more the Monte Carlo tail irritates me. If anyone is thinking about retiring and are trying to get to 100% in a Monte Carlo sim, you are going to work longer than you have to. From what I have found, I can get 100% in firecalc and Monte Carlo is always around 97%. And to get that last 3% in Monte Carlo requires a LOT more money. Firecalc 100% is a good target.

Even Fidelity's calculator which is based on Monte Carlo simulations only goes up to a 90% success rate in its most conservative choice.
 

Latest posts

Back
Top Bottom