But this doesn't validate what you said.
A 1.74% return from March 2000 does not make your previous claim of 1.3% over the past 15 years true.
Sorry if I'm busting your balls but as other poster alluded to it sue seems like you are cherry picking timeframes to try to make a point, and in fact providing questionable information as well that you then attempt to correct with a shrug and new data.
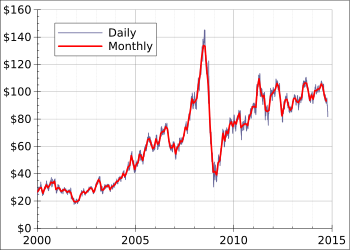
actually that 1.73 was only with the ending of novemenber at 2067. today we are lower so the the return is lower. it is a moving target. the info is constantly updating on the link i posted monthly . december has not been calculated yet. in fact that number reflects no fees at all as funds would have so the origonal number which i think may have been from october's update which i still had may not be far off at this point.
as far as 1.73 vs 1.32 it still is below a 2% real return which spells failure for a 15 year period which generally means a failed retirement in theory mathamatically .
so wehether you kill the portfiolio with a bullet or a grenade math says it is dead anyway and the last 15 years were going to be logged as a failure period. real return on bonds and cash were zero to negative so they didn't provide much help.
t.rowe and raddr did the math for a hypothetical y2k retiree and found 1000 bucks would have been down by 60% in only the first 10 years ,
regardless of how things improved there is not enough money left to act upon since that money still had at least 20 years more to go.
micahel kitces computed that the common denominator to every failed time frame was the fact real return averages for the first 15 years were below 2%.
in no case did what happened after those 15 years make a difference in the outcome once that die was cast as to little money left to help save things.
all that matters is we are below 2% in real return , who cares if is is 1.32 ,1.40 or 1.50 etc , dead is dead.
if you retired at least a year later your withdrawal rate would have been based on a much lower amount so you would be fine from that point on.
however growth on existing money would still have been below average from 2000 on.. the 20 year records and 25 year were heavily influensed by the great 18 year bull market that ran from 1987 to 2004 and averaged almost 14% . these are nominal non inflation adjusted returns.
")