Kitces: How the 4% rule has held up since 2000 & 2008

walkinwood

Thinks s/he gets paid by the post
Joined
Jul 16, 2006
Messages
3,519
Location
Denver
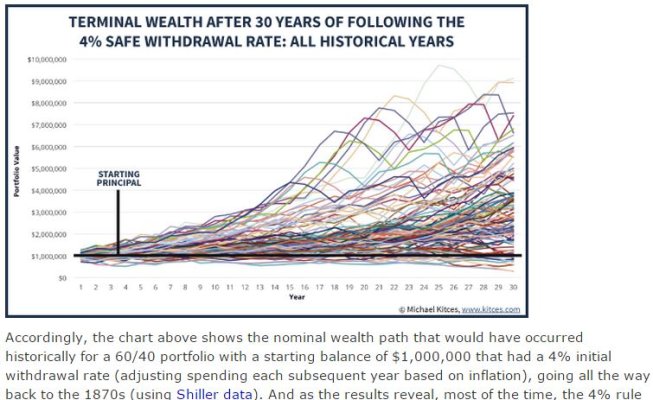
Michael Kitces has written another balanced article.

He observes that the current state of 2000 and 2008 retirees portfolios is comparable to that of 1929, 1937 and 1966 retirees. Better in some respects.

https://www.kitces.com/blog/how-has...bble-and-the-2008-financial-crisis/#more-7856

Be sure to read the last section on historical perspective.

This one observation struck me and I'll incorporate this calculation in my annual analysis of our situation
Still, the current 6.2% withdrawal rate of that year-2000 retiree today is actually modest enough that a retiree couple in such a scenario could simply take the remainder of their portfolio, and buy a joint and survivor single premium immediate annuity with inflation-adjusting payments. At current market rates, the inflation-adjusting payout for the 80-year-old couple (assuming the 65-year-old retirees are now 15 years into retirement) would be 6.5% for their joint lives, more than enough to cover their 6.2% spending rate.
 
His conclusion should (but probably won't - worriers are gonna worry) reduce the "financial anxiety" expressed so often on this forum:

The bottom line, though, is simply to recognize that even market scenarios like the tech crash in 2000 or the financial crisis of 2008 are not ones that will likely breach the 4% safe withdrawal rate, but merely examples of bad market declines for which the 4% rule was created. In turn, this is an implicit acknowledgement of just how conservative the 4% rule actually is, and how horrible the historical market returns really were that created it. In the end, this doesn’t necessarily mean that the 4% rule is ‘sacred’ and that some future market disaster couldn’t be bad enough to undermine it. But when the Great Depression and the stagflationary 1970s couldn’t break it, and the crash of 1987 and even the global financial crisis of 2008 were just speed bumps, it will take a lot to set a new safe withdrawal rate below 4%!

I also thought it interesting how closely this chart resembles the output we see in FIRECalc:
 

Attachments

  • Kitces.JPG
    Kitces.JPG
    80 KB · Views: 122
So, is he saying that the Great Depression, Y2K tech crash and 2008 Recession were such extremes that the 4% rule, being successfully tested against those events, should be 'really' a safe starting point?
 
No. Read the last two sentences in the conclusion quoted above.

"...In the end, this doesn’t necessarily mean that the 4% rule is ‘sacred’ and that some future market disaster couldn’t be bad enough to undermine it. But when the Great Depression and the stagflationary 1970s couldn’t break it, and the crash of 1987 and even the global financial crisis of 2008 were just speed bumps, it will take a lot to set a new safe withdrawal rate below 4%!..."

This quote? My admittedly optimistic interpretation of this is that if these catastrophes couldn't 'break' the 4% rule, it's a pretty 'safe' position.

In stating that going lower than 4% should not be necessary, isn't he implying that those who are more open to risk, that a slightly higher % might be acceptable? I know I'm splitting hairs....
 
My concern about the 4% rule has been very little of whether the 4% rule would actually hold up, but rather whether I could estimate my spending needs and wants accurately enough to keep my spending at 4% plus inflation. That's why I didn't FIRE at 4%.
 
"...In the end, this doesn’t necessarily mean that the 4% rule is ‘sacred’ and that some future market disaster couldn’t be bad enough to undermine it. But when the Great Depression and the stagflationary 1970s couldn’t break it, and the crash of 1987 and even the global financial crisis of 2008 were just speed bumps, it will take a lot to set a new safe withdrawal rate below 4%!..."

This quote? My admittedly optimistic interpretation of this is that if these catastrophes couldn't 'break' the 4% rule, it's a pretty 'safe' position.

In stating that going lower than 4% should not be necessary, isn't he implying that those who are more open to risk, that a slightly higher % might be acceptable? I know I'm splitting hairs....

Presuming I'm running the calculations correctly, there are a few scenarios in the 1970's that would fail at a 4% rate, according to FireCalc.

1970: out of money in 2009
1971: out of money in 2013
1972: out of money in 2008
1973: out of money in 2002

But, on the plus side, only one of those four scenarios failed within 30 years. And chances are, if you factored in SS, you'd be fine.
 
To me the area between 3 and 4% is safe, and in fact studying all the probable outcomes both end up with a huge windfall for your heirs just as the article points out. If you are truly interested in less risk than plans with actions tied to the event of early sequence of return risk is more meaningful. Such as taking actions to reduce spending to take less withdraw, or adding income by working part-time, or taking pension or SS earlier than the delayed plan those of us who plan like this tend to pick. If you just push for lower SWRs you end up working longer, potentially much longer than you needed to and that's tragic since you cant get that back.
 
Last edited:
He also discussed a "ratcheting" rule that addresses in some part the high end values here and a longer version of same here.
 
Well if you were to read the discussion/raging deabate regarding the latest Scott Burns article on the BH forum you would swear this time it really, really, really is different...because...you know...valuations and all, predictions, and oh noooo, never a "forecast", but "simple arithmetic".

I like Kitces. He brings sanity to the world of chartists, fundamentals people, and other mumbo jumbo of those seeking to identify patterns where, if any exist, the accuracy and actionable usefulness of which are highly questionable.

His important point (note the sequence of returns mention):

Of course, given that most of the time, a retiree doesn’t actually turn out to retire on the eve of the next great economic catastrophe, systematically implementing spending at a 4% initial withdrawal rate will most commonly just leave a huge amount of money left over. After all, while sometimes an unfavorable return sequence may occur, in general a 4% withdrawal rate is really quite modest relative to the long-term historical average return of almost 8% on a balanced (60/40) portfolio!

Emphasis Added
 
Last edited:
W

His important point (note the sequence of returns mention):

" a 4% withdrawal rate is really quite modest relative to the long-term historical average return of almost 8% on a balanced (60/40) portfolio!"
I'm not sure where I can get 8% real return on a balanced portfolio. Since the 4% assumes inflation adjustments, I wouldn't compare to a nominal rate.

Using Shiller's data, the real return on a 100% equity portfolio, with no investment expenses, was:
5.5% over the last 50 years
7.0% since WWII
6.8% since the start of the data (1871)

Dilute those returns with 40% bonds (maybe 3% real) and the 4% SWR doesn't seem so unlikely.
 
His conclusion should (but probably won't - worriers are gonna worry) reduce the "financial anxiety" expressed so often on this forum:


I also thought it interesting how closely this chart resembles the output we see in FIRECalc:

So true. At 22 years into ER my old buddies old pals at the IRS have trumped my early in ER el cheapo worried about spending too much with good old RMD.

So now my new worry is to live long enough to spend the big bucks!

heh heh heh - However it's been good - I have successfully avoided WORK!! :D:LOL::LOL::dance::greetings10:.
 
I'm not sure where I can get 8% real return on a balanced portfolio. Since the 4% assumes inflation adjustments, I wouldn't compare to a nominal rate.

Using Shiller's data, the real return on a 100% equity portfolio, with no investment expenses, was:
5.5% over the last 50 years
7.0% since WWII
6.8% since the start of the data (1871)

Dilute those returns with 40% bonds (maybe 3% real) and the 4% SWR doesn't seem so unlikely.

That was only one quote. He in fact uses Shiller's data:

the chart above shows the nominal wealth path that would have occurred historically for a 60/40 portfolio with a starting balance of $1,000,000 that had a 4% initial withdrawal rate (adjusting spending each subsequent year based on inflation), going all the way back to the 1870s (using Shiller data). And as the results reveal, most of the time, the 4% rule just leaves a large amount of principal behind! Over 2/3rds of the time the retiree finishes the 30-year time horizon still having more-than-double their starting principal. The median wealth at the end – on top of the 4% rule with inflation-adjusted spending – is almost 2.8X starting principal. In other words, it's overwhelmingly more likely that retirees will have opportunities to ratchet their spending higher than a 4% rule, than ever need to spend that conservatively in the first place!

Emphasis added
 
That was only one quote. He in fact uses Shiller's data:
Emphasis added
Yes, though I'm never sure how people use Shiller's bond data.

I'm just saying that his "commonsense shortcut" that -- you have to believe that 8% average can cover 4% in the worst years -- is overstating his case.

It's more accurate to say "an average of 5.5% (or whatever) covers 4% in all but the very worst years".
 
He must give more details on his methods somewhere. Do you know where? FireCalc has poorer results than this:
In fact, even when starting with a 4% initial withdrawal rate, less than 10% of the time does the retiree ever finish with less than the starting principal. And it has only happened four times in the ‘modern era’ of markets: for retirees who started a 30-year retirement time horizon in 1929, 1937, 1965, and 1966.
Maybe he is mixing nominal and real again. FireCalc has years when the portfolio goes to zero.
 
Presuming I'm running the calculations correctly, there are a few scenarios in the 1970's that would fail at a 4% rate, according to FireCalc.

1970: out of money in 2009
1971: out of money in 2013
1972: out of money in 2008
1973: out of money in 2002

But, on the plus side, only one of those four scenarios failed within 30 years. And chances are, if you factored in SS, you'd be fine.

This highlights the important entering assumption about the 4% "rule" - it's based on a thirty year time period as you noted. So the 39, 42 and 36 year failure modes depicted above don't reflect in the data.

Great observation about SS, too. I often see folks saying "if you're retiring in your 40s, you shouldn't use 4%." Maybe, but more likely that's still being "too" conservative (if there is such a thing). Retiring at, say 42, means that 20 years into your 30 year calculation, you have a fairly substantial boost to your income that isn't factored in to the 4% rule, and in all likelihood drives your chances of failure going forward toward 0. At the 30 year point, the median remaining portfolio is 2.8X the starting value... not including SS. Take those few cycles that end below your start point, factor in SS at the 20 year point and recalculate, and I'd bet none cross the 0. (tough to do because SS will be a huge impact for some, more modest for others, depending on spending/savings levels).

Of course, I'm still planning to 3-3.5% figuring if I can make that, yeah, I might fly business class...
 
Last edited:
It's worth noting that Raddr's analysis paints a fair less rosy picture, than Kitces for the Y2K retiree.

Nobody updated the spreadsheet for 2014. So I did on a real basis the Y2K retiree has $387K left and his 40K real withdrawal this year(55K nominal) is a 10.3% right on track with the 1966 retirees, after 15 years into their retirement.

The S&P is flat this year and T-bill still pay nothing so there is a good chance that he'll start 2016 with <350K 9 year money and 14 years left.

Now there key difference between what Raddr has done and Kitces. First Raddr was using 75/25% (that's default for FIRECalc and certainly conventional wisdom for an early retiree). I think Kitces 60/40 is probably too conservative for an early retiree in 2000. I eventually got to 60/40 but that was as much do to the bear market of 2000-2002 as anything else.

Raddr was 25% was invested in T-bills which was conventional wisdom at the time. I believe that is probably too conservative, and while I bought plenty of bonds in 2000, included TIPs and Ibonds, I doubt many people had $250K in T-bill a 5% cash allocation is probably more realistic with the reminder invested in longer bonds or CD.

My guess is that for the few foolish Y2K retiree not to have made adjustment to spending in the last 15 years, they probably have an amount slightly higher than Raddr calculations but well below Kitces.

Now the big difference is age. Kitces properly points out that a 65 year old is an 80 now and he could buy an annuity even with Raddr numbers that would pay him $3,600 (in 2000 dollars) a month for life. But I was 40 in 2000 that same portfolio only buys me $1,800/month for life (with no COLA). That's only 21.6K a year, a drastic cut in lifestyle. The good news is at 62 I get an additional $1,047 (2000 dollars) so I won't be in the cat food camp. But the next 7 years wouldn't pretty. The alternative would be to continue spending my $40K a year and count on running of money right around the time I hit full SSA retirement. I'd collect 2K/month in today dollars but only $1470 in (year 2000 $). Now 1/3 of people retire with basically only SS.
 
Last edited:
I don't think 60/40 is too conservative for a year 2000 early retiree. That's where I started. I was running around 58/42 by mid 2000s and by 2009 55/45 was more comfortable. I'm not much below that now.
 
Presuming I'm running the calculations correctly, there are a few scenarios in the 1970's that would fail at a 4% rate, according to FireCalc.

1970: out of money in 2009
1971: out of money in 2013
1972: out of money in 2008
1973: out of money in 2002

But, on the plus side, only one of those four scenarios failed within 30 years. And chances are, if you factored in SS, you'd be fine.

Not only do three of the four "failures" occur beyond 30 years, the one failure within thirty years (#4 above, ending in 2002), last 29 years! In truth, this data tends to encourage optimism, not concern, about the 4% withdrawal rate. Unless the retiree concerned retired at age 32, SS would be available as a backup in the above scenario.
Separately, Firecalc always seems to provide more favorable numbers than ********. Wanting to err on the side of caution, I tend to view the data as more reliable if it comes from the more pessimistic, rather than the more optimistic calculator.
 
i found the article pretty comforting . i am retired as of tomorrow at 4:30 pm. YIPEE!
 
Kitces: How the 4% rule has held up since 2000 &amp; 2008

This look at a variety of portfolios withdrawing the classic 4% should be comforting

http://www.retireearlyhomepage.com/reallife15.html

Looking back over the past twenty years, I thought it might be interesting to see how some popular investment strategies have fared since I quit work in November 1994...
The good news is that anyone with a reasonably diversified portfolio did just fine. It's not bad news, but, of course, some strategies performed better than others...
[the article]shows the results for a $100,000 starting balance and a 4% of assets initial withdrawal indexed annually for inflation. Vanguard index funds are used whenever possible in this analysis.


Sent from my iPad using Early Retirement Forum
 
I don't think 60/40 is too conservative for a year 2000 early retiree. That's where I started. I was running around 58/42 by mid 2000s and by 2009 55/45 was more comfortable. I'm not much below that now.

I struggle with this. I've read reducing equity exposure at retirement, even without using a rising glide path, helps to reduce sequence of returns impact. Were you at all concerned with SOR, and if not, why not? Also, can you explain your reasoning behind feeling 60/40 isn't too conservative for someone in retirement? I ask because I'm at 40/60 having just retired and whether I raise that ratio will depend a lot on what the PF looks like in say, 5 or 10 years.

Just interested in your thinking in order to perhaps educate mine.
 
This look at a variety of portfolios withdrawing the classic 4% should be comforting

2014 Update: Real-Life Retiree Investment Returns


Sent from my iPad using Early Retirement Forum

Yes it was nice to see intrcast is still updating the site, 20 years later.

He pointed out that the Harry Brown permanent portfolio, which appeared to be doing great was actually only doing well because of a spreadsheet area. It does lead one to question how many other spreadsheet and logic errors are out in financial planning. God knows I've made my share.

It also goes to show that when you retire is almost as important as how much, 1994 was a pretty good year. Modest inflation and right before the start of great bull run.
 
Back
Top Bottom