Kitces: Preparing for Lower Long-Term Returns

yes - I think you are correct. It does not account for sequence of return risk. (But, of course, the premise of the discussion was that the next 15 years would have the 2% real return)

2% real return on average. The sequence of returns still applies.
 
How many 30+ year periods in the data set start with valuations of both stocks and bonds as high as those currently? I count 0. How many started with just equity valuations above 24x? Basically 2, around 1900 and again in 1928-29.

If we're using data to project for periods where we know the starting conditions lie outside the data set then it is wise to proceed with caution . . . or, at the very least, make adjustments to bring your starting position back in line with the available data.
Agreed. We're on the ragged edge of the already thin data set, with just one chance to get it right. And the fundamental economic conditions that set the US up for world-leading growth rates for much of the reporting period (and which salvaged many previous 30+ year windows with "poor starts) are certainly not guaranteed (or even likely, IMO).
Yes, caution is warranted.

+1

It's always possible that the 21st century ends up rivaling the 20th in terms of economic growth, but it's hard not to think that the 20th century was pretty remarkable for the U.S.

Demographics aren't as favorable. Women can't again enter the workforce for the first time. Educational attainment isn't likely to increase the way it did from the start of the 1900s. Productivity growth is currently much lower than before 1970, etc.

Oh, and valuations are much worse.

So the belt, suspenders, and safety pin plan may be what is called for. If I'm wrong, the "downside" is that I'll have plenty of cash to buy that pied-a-terre in Paris I've always wanted for my golden years. And that will be tough.
 
Last edited:
And if Kitces is correct in his low growth 2% real return, then one can in effect just " spend the dividends" ... A safe withdraw rate at a low (15%) tax rate .. And the market will return enough to keep the base portfolio flat to inflation ..... In theory ... of course.
Hmmm--and if this goes on for 10 years, where will valuations be then? We're positing that stock prices stay flat in real terms, and that dividends (earnings, for our purposes here?) also stay flat at about 2%. That means valuations (stock price/avg previous 10 years earnings) will also remain unchanged at their existing high levels. High valuations = continued low dividend yields and (according to the previous history) , no realistic expectation of significant price appreciation.
If we want the flowers, we have to accept the rain. If we want higher dividend yield and (eventually) higher stock price growth, then the real price of equities needs to drop. That'll sting a bit.
 
Last edited:
How many 30+ year periods in the data set start with valuations of both stocks and bonds as high as those currently? I count 0. How many started with just equity valuations above 24x? Basically 2, around 1900 and again in 1928-29.

I think PE10 just made it over 24 in 1966. Of course that does not bode well either as it is a failure case in SWR simulations at 4%.

What we want is the conditional probability of failure given a high starting PE10. I think 1900 and 1928 actually survive, so that leaves 1 out of 3 or 33% for a naive estimate.

You're right, 1966 squeaks in at 24.06x. 10-year treasuries were at 4.6% then, though.

In any case, we have three data samples that suggest a 66% probability of success (ignoring bond yields).

How much does anyone want to bet on the outcome of a 4th trial based on that sample set?

I bet nothing.
 
Interesting Kitces interview at M* where he discusses the predictive capability of Shiller CAPE and points out that 15 years has the best predictive capability which happens to correspond to that initial period which can make or break portfolio survival.

You can read the transcript if you don't want to watch the video
Preparing for Lower Long-Term Returns
I'm convinced that the PE10 ratio has been widely misinterpreted. This is a good article which summarizes critiques of the PE10:
Article Archive
The goodwill effect equals four points of the Schiller CAPE ratio, which drops from 24.5 under the traditional calculation to 20.6 for Livermore's version. Effectively, then, that single accounting adjustment alters the ratio's signal so that instead of suggesting that stocks are abnormally high in price, they are instead only on the higher side of normal--with plenty of history suggesting that they could move higher yet.
...when an empirical measure begins to sputter, it's probably best to move on. It's not as if the ratio's use is supported by theory.
Swedroe also did a recent article discussing similar findings.
 
Agreed. We're on the ragged edge of the already thin data set, with just one chance to get it right. And the fundamental economic conditions that set the US up for world-leading growth rates for much of the reporting period (and which salvaged many previous 30+ year windows with "poor starts) are certainly not guaranteed (or even likely, IMO).
Yes, caution is warranted.

In the 1970's Jimmy Carter gave his famous age of limits speech that turned out to be at least one of the reasons he wasn't reelected. It did seem at the time that he was right: America would grow no more, at least not like it had in the past. Then in the 1980's it was "Morning in America" with a turnaround unforeseeable in in the 1970's. Then in 1989 (?) it was the infamous "Death of Equities". We know how that turned out.

Predictions, even coming from someone I esteem as highly as Michael Kitces, always make me quesy. These are predictions, forecasts, and when it comes to forecasts I like everything Buffet (and a whole lot of others) has to say about them (ignore them, basically).

See this:

https://www.bogleheads.org/forum/viewtopic.php?f=10&t=184268&newpost=2795523

I started the Boglehead Contest in 2001 to show that no one can predict the stock market except by luck (or changing their forecasts :wink: ).

Emphasis added

If you've done the hard work of having accumulated a sufficient PF, lowering your AA the 5 years before/after retirement, created an ISP with a plan B, C,, and possibly D, SOR shouldn't bother you. At that point, there's nothing you can do about a bad SOR at the start of retirement anyway. As Otar says, it's the "luck factor".
 
Last edited:
I'm convinced that the PE10 ratio has been widely misinterpreted. This is a good article which summarizes critiques of the PE10:
Article Archive
Swedroe also did a recent article discussing similar findings.

I'd like to dig into the analysis that yields this conclusion.

Prior to 2002 Goodwill was amortized annually. Now it is subject to periodic impairment tests. It's not clear to me that over time one method yields higher earnings results than the other, although it's certainly possible.

What we do know is that earnings with periodic impairment will be more volatile then when using straight line depreciation. And we have indeed seen more earnings volatility.
 
Has Kitces written about the relationship between current CAPE and SWR over periods of 30-40 years? And how do you account for current bond yields in that relationship?

To me, in the de-accumulation phase, that's the important data point.

Yes - he says that for 30 years the predictions are as bad as for one year - poor. In other words, not useful.

No accounting for bond yields.
 
In the 1970's Jimmy Carter gave his famous age of limits speech that turned out to be at least one of the reasons he wasn't reelected. It did seem at the time that he was right: America would grow no more, at least not like it had in the past. Then in the 1980's it was "Morning in America" with a turnaround unforeseeable in in the 1970's. Then in 1989 (?) it was the infamous "Death of Equities". We know how that turned out.

Predictions, even coming from someone I esteem as highly as Michael Kitces, always make me quesy. These are predictions, forecasts, and when it comes to forecasts I like everything Buffet (and a whole lot of others) has to say about them (ignore them, basically).

See this:

https://www.bogleheads.org/forum/viewtopic.php?f=10&t=184268&newpost=2795523


Emphasis added

If you've done the hard work of having accumulated a sufficient PF, lowering your AA the 5 years before/after retirement, created an ISP with a plan B, C,, and possibly D, SOR shouldn't bother you. At that point, there's nothing you can do about a bad SOR at the start of retirement anyway. As Otar says, it's the "luck factor".
Kitces is not actually predicting - he is talking about how different indicators have worked as past predictors. That is an entirely different message.
 
Hmmm--and if this goes on for 10 years, where will valuations be then? We're positing that stock prices stay flat in real terms, and that dividends (earnings, for our purposes here?) also stay flat at about 2%. That means valuations (stock price/avg previous 10 years earnings) will also remain unchanged at their existing high levels. High valuations = continued low dividend yields and (according to the previous history) , no realistic expectation of significant price appreciation.
If we want the flowers, we have to accept the rain. If we want higher dividend yield and (eventually) higher stock price growth, then the real price of equities needs to drop. That'll sting a bit.


It will depend on what earnings do.

It is feasible that earnings rise more than the 2% real stock market price returns + 2% dividend yield.

In that market case valuation falls.

There are times when earnings grow but stock prices do not. It could be a valuation "catch up" decade.

the earnings growth story forecast question has not been answered /addresses yet ... That's the other piece of the puzzle of course.
 
If you've done the hard work of having accumulated a sufficient PF, lowering your AA the 5 years before/after retirement, created an ISP with a plan B, C,, and possibly D, SOR shouldn't bother you. At that point, there's nothing you can do about a bad SOR at the start of retirement anyway. As Otar says, it's the "luck factor".
Right, but you've said a mouthful with those "if you've done" steps. There are some practical things (esp the need for spending flexibility ("cushion") and the very high utility of variable withdrawal amounts based on annual portfolio performance) that are essential for those considering retirement at high valuations to understand.

I'd like to dig into the analysis that yields this conclusion.
I didn't find the article lsbcal was citing on the M* site, but here's the reprint at Yahoo. No deep details there, however.
 
Kitces is not actually predicting - he is talking about how different indicators have worked as past predictors. That is an entirely different message.

Investors may not be rewarded for risk-taking during the next several years, so they should tweak their spending and saving patterns instead, says financial-planning expert Michael Kitces

Sounds like the usual, typical, hedged prediction to me. And tweaking one's spending patterns in response to market behavior is not at all new news.

Here's what Josh Brown has to say:

Nobody Knows Nothing, Episode 653

Stop already. Strategists are interesting to read for context and to understand what other large pools of money and investors are thinking. Even the strategists themselves hate the fact that they have to play the target game.
...

One of the benefits of having an investment process with diversification and a rules-based orientation is that you don’t end up chasing the guesses of others. Anyone’s guess is as good as anyone else’s in a world of almost infinite variability.

Emphasis added
 
You're right, 1966 squeaks in at 24.06x. 10-year treasuries were at 4.6% then, though.

....

Interesting discussion...

I wondered about inflation when I saw the 4.6%. C.P.I. inflation rate in 1966 (December v. Dec. 1965) was 3.46% Inflation 1966 – Overview CPI inflation by country in 1966

Granted, the inflation measurement goal posts have moved over the years and I am not competent to attempt those adjustments, but taking it at face value, that would indicate a real yield of 1.14%. Still better than the present quote on 10 year TIPS (.53%), but closer than I would have thought.
 
Right, but you've said a mouthful with those "if you've done" steps. There are some practical things (esp the need for spending flexibility ("cushion") and the very high utility of variable withdrawal amounts based on annual portfolio performance) that are essential for those considering retirement at high valuations to understand.
...

Those are very good points. The mouthful (which I admittedly was too lazy to go into) is that there are no shortcuts to effective PF management. If you want to retire early and do it successfully, AFAICT there is no other way than doing the hard work of learning everything there is about it. Having a cushion (or Plan B or C, or whatever) is one small part of that. Further, as I said above, variable PF withdrawal amounts based on market/PF performance is not at all new news.
 
Interesting discussion...

I wondered about inflation when I saw the 4.6%. C.P.I. inflation rate in 1966 (December v. Dec. 1965) was 3.46% Inflation 1966 – Overview CPI inflation by country in 1966

Granted, the inflation measurement goal posts have moved over the years and I am not competent to attempt those adjustments, but taking it at face value, that would indicate a real yield of 1.14%. Still better than the present quote on 10 year TIPS (.53%), but closer than I would have thought.

I'm not so sure, and here's why.

We buy bonds not with the hindsight knowledge of what inflation will actually happen, but with a guesstimate of what future inflation might be. The real yield at the time bonds are sold is the nominal rate less that expected inflation component. We don't have the tools today to know with certainty what inflation investors expected back when they bought bonds in January 1966, but we can make an educated guess.

As a first order approximation I'd wager inflation expectations for the year ahead were pretty close to the rate actually experienced in the year past. And according to your same source, inflation in 1965 averaged 1.58%.

So it's possible bond buyers in 1966 thought they were getting something closer to a 3% real yield (even though future events didn't turn out the way they expected.)

And that makes sense with the data I have. When I subtract from the 10-year treasury rate the inflation rate realized during the previous 12 months, I get a median value of 2.55% and an average of 2.2% for the period from 1955-1966. So it's not unreasonable to think the real yields investors demanded were somewhere north of 2% back in the mid 60s.

Even if I'm wrong on this front, that doesn't change the fact that someone lending at 4.6% has a much greater cushion against adverse events than someone lending at 1.74%.
 
Last edited:
The issue with inconsistent earnings in CAPE/PE10 has been discussed here, on bogleheads, and on other places on the web. My reading of it, as an amateur, is that the discussion is about whether equities have abnormally valuations or just high valuations. I believe the latter, but it doesn't matter as the conclusion is the same. High valuations implies lower expected returns. Lower expected returns means that a given SWR percentage will likely have a higher failure rate in the future than the past.

The size of the effect is debatable. I'm quite comfortable with treating 3% as the new 4%. But others may come to different conclusions for good reasons.

The best description of Livermore's objection to traditional CAPE is on his blog: Fixing the Shiller CAPE: Accounting, Dividends, and the Permanently High Plateau | PHILOSOPHICAL ECONOMICS . He's basically making the argument that instead of GAAP earnings, one should use pro-forma earnings. However, even by pro-forma earnings, equity valuations are still higher than historical (still implies lower expected returns).

I have also read other experts claim that using pro-forma earnings in CAPE are upward biased (i.e. too optimisitic). In any case, I know of no credible experts predicting expected returns as high as the US historical average. Livermore himself says "There is no question that the current stock market is more expensive than the averages of certain past eras–the 1910s, 1930s, 1940s, 1970s, 1980s, etc. Looking forward, long-term equity returns will obviously be lower than they were in those eras"

Another way of computing expected returns is to use the Dividend Discount Model pushed by bogle and others. This is generally more pessimistic than CAPE even without mean reversion of valuations. Again lower expected returns implies higher failure rates for a fixed SWR percentage.
 
The best description of Livermore's objection to traditional CAPE is on his blog: Fixing the Shiller CAPE: Accounting, Dividends, and the Permanently High Plateau | PHILOSOPHICAL ECONOMICS .

Oh, boy.

I can't find a source for how Bloomberg arrives at the pro-forma earnings index that Livermore uses but my guess is that they're just grabbing the non-GAAP numbers reported in companies' quarterly press releases.

Those pro-forma earnings calculations include a huge number of adjustments, many of which have nothing to do with Goodwill. By and large, those adjustments just add back things that happened that companies either wish didn't or that they want analysts to exclude as "one time."

A better definition for these "pro-forma earnings" numbers might be "earnings excluding all the bad stuff."

And they're a relatively recent phenomenon, so it's no surprise that an index tracking pro-forma earnings would increasingly diverge from GAAP earnings as more and more companies issue their own better-than-GAAP calculations.

I'm not sure "pro-forma" earnings show what Livermore thinks they show.

His argument about NIPA profits might be more persuasive if he demonstrated that those cumulative profits are much higher than those reported by companies under GAAP. But that's not what he does. He only shows that the coorelation between the two isn't as high as it once was.

That doesn't mean GAAP profits are lower (or higher), just that they don't track as well. And an increase in large non-cash writedowns may well be the reason. But that just means GAAP earnings are more volatile than NIPA profits, not necessarily lower.

Count me as not convinced.
 
Last edited:
I guess for me it means that even though real returns might only be 2%, that 3% withdrawal rate is still quite reasonable for long retirement (and even 4% swr for someone planning only 30 years)

When we decided to not work full time, 30 year TIPS were yielding ~2% real fairly risk free and we decided good enough. With spending principal over 40 years that could be up to another 2.5% (100/40 years). We aren't 100% TIPS and now yields are lower so we use 1% real instead of 2% in our plan, with the option of spending all or part of the 2.5% principal SWR there as well.
 
My approach is to discount current markets back to a level that represents the median valuation of the data set used to originally calculate your SWR. If you're using FIRECalc and PE-10, that would mean discounting the current equity market down to a valuation of about 16x from it's current 24x (a 33% haircut).

I'd also do the same thing with the bond market. 10-year treasuries are yielding 1.74% versus a median of 3.89%. Using an average bond market duration of about 6 years, that 200bp lower current yield results in a price discount of about 12%.

So assuming a 1MM portfolio and a 50/50 asset allocation, I'd mark the $500,000 in stocks down by 33% to $333,000 and the bond allocation down by 12% to $440,000.

My resulting $773,000 portfolio puts me right in the middle of the valuations used in our historic data set. Applying a 4% SWR, I get a withdrawal of about $31,000.

That means my undiscounted portfolio can support a withdrawal rate of 3.1%. Said another way, a 3.1% withdrawal today is equivalent to a 4% withdrawal at median valuations.
That is a very interesting way of looking at it.

I note that for a median valuation portfolio, the safe withdrawal rate will be higher than 4%. 4% is for a worst case scenario indicating valuations are messed up at one end or another. I don't remember what the median safe withdrawal rate was - something like 5% or slightly higher?
 
My approach is to discount current markets back to a level that represents the median valuation of the data set used to originally calculate your SWR. If you're using FIRECalc and PE-10, that would mean discounting the current equity market down to a valuation of about 16x from it's current 24x (a 33% haircut).

I'd also do the same thing with the bond market. 10-year treasuries are yielding 1.74% versus a median of 3.89%. Using an average bond market duration of about 6 years, that 200bp lower current yield results in a price discount of about 12%.

. . . .
That means my undiscounted portfolio can support a withdrawal rate of 3.1%. Said another way, a 3.1% withdrawal today is equivalent to a 4% withdrawal at median valuations.

That is a very interesting way of looking at it.

I note that for a median valuation portfolio, the safe withdrawal rate will be higher than 4%. 4% is for a worst case scenario indicating valuations are messed up at one end or another. I don't remember what the median safe withdrawal rate was - something like 5% or slightly higher?

If we had a very big decline in equity prices (thus, a lower PE10 and lower valuations), Gone4Good's method would require (or at least allow) for a much higher withdrawal percentage that year--maybe 8% or more if we got down to CAPEs of about 10. Emotionally, after a drop in my stock portfolio of more than 60%, I don't think it would be easy (or even possible), to withdraw that much of the beaten-down equities unless it were truly a necessity (i.e. needed for the most Spartan essential spending). I believe in the utility of the CAPE, and I believe in mean reversion, but that would be quite a leap.
 
Last edited:
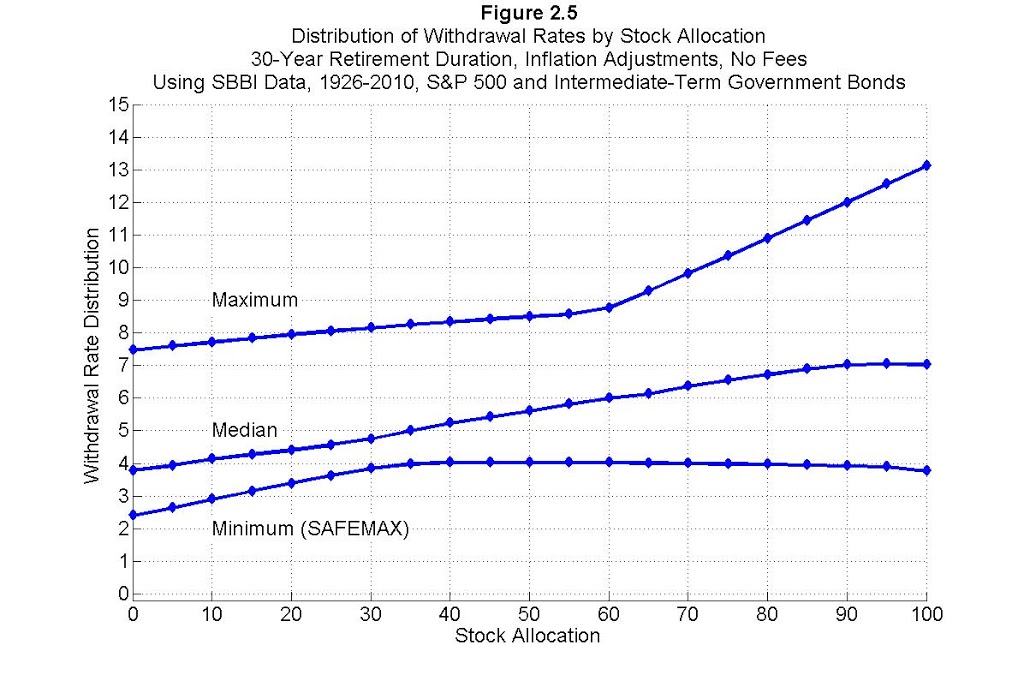
I note that for a median valuation portfolio, the safe withdrawal rate will be higher than 4%. 4% is for a worst case scenario indicating valuations are messed up at one end or another. I don't remember what the median safe withdrawal rate was - something like 5% or slightly higher?
Median SAFEMAX - for the 30 year period, of course.

Fig2_5-300x1971.jpg

From http://retirementresearcher.com/william-bengens-safemax/
 
Last edited:
If we had a very big decline in equity prices (thus, a lower PE10 and lower valuations), Gone4Good's method would require (or at least allow) for a much higher withdrawal percentage that year--maybe 8% or more if we got down to CAPEs of about 10. Emotionally, after a drop in my stock portfolio of more than 60%, I don't think it would be easy (or even possible), to withdraw that much of the beaten-down equities. I believe in the utility of the CAPE, and I believe in mean reversion, but that would be quite a leap.
I thought he was talking about 33% drop from a bit above today's levels (we are under 24% now), not 60%?

You are talking more about undershooting?
 
Since I use % of remaining portfolio as my withdrawal rate, I can't really project lowering the withdrawal % now in anticipation of a reversion to mean 10 years from now.

I would have to have a dynamic withdrawal % that dropped when valuations were high, went to a median level when valuations seemed to be median, and raised when valuations were low.

Using the initial portfolio value and adjusting withdrawals for inflation each year kind of does that - but the starting point is arbitrary in terms of valuation. That is why SAFEMAX ends up being low so it is a conservative choice.
 
Back
Top Bottom