Kitces: Preparing for Lower Long-Term Returns

Here's a simpler way to look at it. From my earlier post,


This means that the portfolio (without withdrawal) is exactly flat once inflation is accounted for. Your spending should be also adjusted for inflation. So, let's think about the dollar in 1966 valuation terms.

You have $1M to start out with. It stays constant (in 1966 terms).

You keep spending 3% a year, again in 1966 terms. So, in 10 years, you spend 30%, and so forth. In 17 years, you spend 3 x 17 = 51%. No matter what the nominal value is, your portfolio has shrunken to 1/2 of its original purchasing power.

What I found as very interesting is that it was the same whether you do 100% stock or 100% T-Bill in that 17-year period.

You can keep some "off-portfolio" money, and if it also has no gain, your total on+off portfolio is still the same. It can be 100% off-portfolio or 100% on-portfolio, your total amount still goes down to 1/2 in 17 years.

Now, one can look closer and see if an opportunist could rebalance between the two stock and T-bill, as they probably were not always in sync. He could pick up a bit of gain there. This is something I am going to look at for myself next, using the raw data from the Fed.
Because of market volatility, I don't think you can use the analysis this way for the same reason annual average returns cannot be used to predict the survival rate of a portfolio, and why FIRECALC uses actual historical runs to see how high/low your portfolio gets each year and which year you would run out of money.
 
Last edited:
Correct. We need FIRECalc because market performance fluctuates. I was talking specifically about the peculiar period of 1966-1983, where the two end points are exactly flat. And I brought that up was because there's a risk we will go through that again. It's about that pesky high PE10.

What is the point of looking at performance with no withdrawals? We are looking at historical real portfolio performance while withdrawing...

Looking at performance without withdrawals is important, because it gives us the upper bound of how much we can spend. That's exactly the point of Kitces interview, and the point pundits like Shiller and Bogle have been warning us about. When the long-term return is low (or zero as in 1966-1983), there's nothing to do but to reduce spending.

Of course good traders can make money from short-term fluctuations, but the common retiree who does not jump in/out of the market can only rely on long-term performance.

When the market is flat (dividends and interests barely cancel out inflation as in 1966-1983), we are spending principal, no matter what our WR is. The more you spend, the faster you deplete it. If you do not spend, it still does not grow.
 
Last edited:
Speaking of using historical averages to set expectations, I remember an interview with Bogle when he sounded frustrated with pension funds using high return estimates. I will have to look for the exact quote, but he basically said that there was no point in using the historical average when our current condition is not average.

Using FIRECalc is good to see for ourselves what the range of outcome has been, from becoming nearly broke with a 4% WR to becoming a decamillionaire using the same 4% WR. People are telling us that our future looks more like the first extreme than the latter.
 
Did Kitches consider international allocations in his analysis?

It seems limiting to base future equity returns based only on S&P500 valuations. I agree that future S&P returns will probably be low based on current PE10 valuations, but it's not the only market out there. Taking a look this morning, I found a paper analyzing global returns based on Schiller's CAPE: http://www.starcapital.de/files/pub...tock_Market_Returns_Shiller_CAPE_Keimling.pdf

Figure 17 in the paper is interesting. It shows lower predicted returns for S&P500 (4.1%). International (excluding Japan/Denmark) are between 5-10%. If we believe that CAPE is predictive, then there are equity markets that may produce better returns.
 
Correct. We need FIRECalc because market performance fluctuates. I was talking specifically about the peculiar period of 1966-1983, where the two end points are exactly flat. And I brought that up was because there's a risk we will go through that again. It's about that pesky high PE10.
For my purposes I need to know what will happen each of the intervening years, because that lets me know how low the portfolio might go in real terms, and that impacts my income during those intervening years. That's what I might have to live with.

How low might my income shrink is shown in the table above. In the event that we hit a 1966 type scenario, I needed to know that my income might drop below 70% from where I started, for 11 years in a row, within that run below 60% for 3 years in a row, and as low as 54% one of those years. The portfolio doesn't drop more than half in real terms, which is a good thing, nevertheless you are looking at 16 years of shrinking real income, and you had better be prepared to deal with that.

Once recovery starts - hurrah! But you gotta get past those initial years first.
 
Did Kitches consider international allocations in his analysis?...
Ah hah! Someone finally brings this up.

Well, the above reason has been why I have been holding a larger AA in international stocks, particularly EM as I think developed European economies don't even look as good as that of the US.

Alas, I am still waiting to be vindicated. The past few years, I have been trailing the S&P for the above reason.

Now, US companies are doing a lot of business overseas too, probably a lot more than in 1960s and 1970s. Would that keep us from repeating that stagnant period? But then, we are talking free trade and all that politics stuff.
 
Last edited:
For my purposes I need to know what will happen each of the intervening years, because that lets me know how low the portfolio might go in real terms, and that impacts my income during those intervening years. That's what I might have to live with...

Once recovery starts - hurrah! But you gotta get past those initial years first.
Fair enough. My cursory look at the portfolio 1966-1983 performance sans WR showed me that it bounced around but stayed relatively flat during that period. By drawing from T-Bill or stock as appropriately, whatever performs better that year, the retiree could average it out. But the only thing that can matter is that his spending has to be low. Stocks simply did not spring eternal as they did in the boom years of 1983-2000, which many of us got so accustomed to.
 
... Taking a look this morning, I found a paper analyzing global returns based on Schiller's CAPE: http://www.starcapital.de/files/pub...tock_Market_Returns_Shiller_CAPE_Keimling.pdf

Figure 17 in the paper is interesting. It shows lower predicted returns for S&P500 (4.1%). International (excluding Japan/Denmark) are between 5-10%. If we believe that CAPE is predictive, then there are equity markets that may produce better returns.
Looking for a low CAPE, we would want to bet on Italy, Spain more than on France and Germany. Something to think about.

And I found it interesting that the MSCI Greece index shrunk to just 2 companies in 2013, from 21 companies earlier. Hah! Greek economy was really that bad.
 
Ah hah! Someone finally brings this up.

Well, the above reason has been why I have been holding a larger AA in international stocks, particularly EM as I think developed European economies don't even look as good as that of the US.

Alas, I am still waiting to be vindicated. The past few years, I have been trailing the S&P for the above reason.

Now, US companies are doing a lot of business overseas too, probably a lot more than in 1960s and 1970s. Would that keep us from repeating that stagnant period? But then, we are talking free trade and all that politics stuff.

I'm also awaiting vindication. This reminds me of a quote by Greaney, "Which brings us to an important investing truism -- it's OK to under perform as long as you're pleased with the results and proud of what you are doing."

I'm not sure I'm proud, but I sure feel better with my hedging strategy. I'm a lazy (passive) investor and I split US and International 50/50, partially for this reason. For the sake of valuations, I don't think it matters that a lot of US companies have a lot of overseas business. What matters is how expensive it is to invest in those companies and right now, it's more expensive than a lot of the companies outside the US. Yes, valuations do matter.

It's really not that difficult. What are the odds that US with a high PE will do better than country X with a low PE. The data shows that the odds favor country X over a long timeframe. How to invest based on this...well, that's the hard part. For all we know US PE can keep increasing (we've hit 40+ in the past) while International stays low. So spread the money around and hope that it averages out to a reasonable return. At least that's my strategy.

Looking for a low CAPE, we would want to bet on Italy, Spain more than on France and Germany. Something to think about.

There's more to it than just a low CAPE, it's also the internal policies of the country. Both Italy and the UK have a CAPE of 12.7. I'd pick the UK over Italy.
 
I'm also awaiting vindication. This reminds me of a quote by Greaney, "Which brings us to an important investing truism -- it's OK to under perform as long as you're pleased with the results and proud of what you are doing."
I am not pleased, nor proud.

For the sake of valuations, I don't think it matters that a lot of US companies have a lot of overseas business. What matters is how expensive it is to invest in those companies and right now, it's more expensive than a lot of the companies outside the US. Yes, valuations do matter.

It's really not that difficult. What are the odds that US with a high PE will do better than country X with a low PE. The data shows that the odds favor country X over a long timeframe. How to invest based on this...well, that's the hard part. For all we know US PE can keep increasing (we've hit 40+ in the past) while International stays low. So spread the money around and hope that it averages out to a reasonable return. At least that's my strategy.

There's more to it than just a low CAPE, it's also the internal policies of the country. Both Italy and the UK have a CAPE of 12.7. I'd pick the UK over Italy.

People also use PEG. A company with a better growth prospect is awarded a better P/E. A company with an E that shrinks steadily with time is punished with a low P/E. It's the same with countries.
 
For my purposes I need to know what will happen each of the intervening years, because that lets me know how low the portfolio might go in real terms, and that impacts my income during those intervening years. That's what I might have to live with.

How low might my income shrink is shown in the table above. In the event that we hit a 1966 type scenario, I needed to know that my income might drop below 70% from where I started, for 11 years in a row, within that run below 60% for 3 years in a row, and as low as 54% one of those years. The portfolio doesn't drop more than half in real terms, which is a good thing, nevertheless you are looking at 16 years of shrinking real income, and you had better be prepared to deal with that.

Once recovery starts - hurrah! But you gotta get past those initial years first.

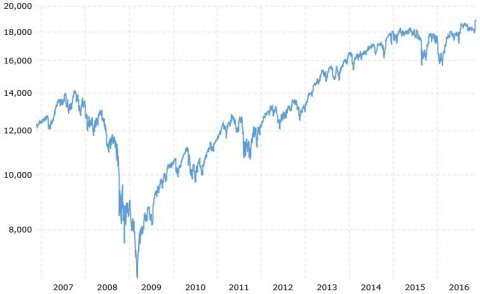
Right now, we have been experiencing an extended "hurrah!" situation. Still, my guess is that many of us are holding back in our spending nevertheless. Seriously, look at this graph of the Dow versus time for the past 10 years, that I got from the internet. A graph of the S&P looks fairly similar. Makes me want to break loose and utter a resounding


~~WHEEE!!!!~~


How many of us are truly relishing, enjoying, and taking advantage of the financial freedom that this graph is illustrating? I think that the present is a time we should remember for many, many years. Are we all spending a little more this year than we did in 2009? I hope that we are taking a break from our incessant preparations for the next recession in order to do so. It is wonderful to be as fully aware and in touch with the "up years" as we are with the "down years" that inevitably follow.


Attachments

  • Capture.JPG
    Capture.JPG
    17.8 KB · Views: 42
Last edited:
You have $1M to start out with. It stays constant (in 1966 terms).

You keep spending 3% a year, again in 1966 terms. So, in 10 years, you spend 30%, and so forth. In 17 years, you spend 3 x 17 = 51%. No matter what the nominal value is, your portfolio has shrunken to 1/2 of its original purchasing power.
Assuming a person would blindly take the same dollar amount out of their portfolio while it has no gains for 17 years. If, instead, our retiree takes 3% out of the year-end balance for 17 years of no-growth, he would >not< be down to 49% of his starting portfolio, he'd be down to 60% (or, to put it more appropriate term, it is now 20% larger). Yes, his annual withdrawals would have gradually decreased in size by 40%, but he's had almost 2 decades to accommodate that decrease in available spending, as it happened at 3% each year.
 
Last edited:
What you describe is most likely to happen in real life. I was describing how a constant $ WR would deplete a portfolio in those stagflation years.

But even if a person does not or cannot reduce his spending, is it really that bad, spending down 1/2 of your stash in 17 years, or depleting it in 33 years? I guess if you live to 100, it is of a concern, but most people do not last that long.

I think the prospect of low returns in the coming years is of more importance to the really young ER who quit work in the 40s. And for those who are still accumulating, it may break their heart to hear that it may take longer for them to reach their dream.

PS. Here's an old thread about Shiller telling people to live like a student in order to save for retirement: http://www.early-retirement.org/forums/f28/shiller-live-like-a-student-and-save-76009.html.
 
Last edited:
But even if a person does not or cannot reduce his spending, is it really that bad, spending down 1/2 of your stash in 17 years, or depleting it in 33 years? I guess if you live to 100, it is of a concern, but most people do not last that long.
Speaking only for myself, yes it would really be that bad.
1) It is all well and good to look, retrospectively, at a series like Audrey posted and say we could wait until our portfolio returns to normal. Real life isn't like that--we don't know for sure it will ever go back up. Frankly, after 15 years of flat returns I'd be very concerned (along with every news show and economist that would be bombarding us with commentary) that something was structurally very different and very broken. It would be very small comfort that the US, in a totally different set of circumstances, had recovered from bad times. Some countries haven't.
2) Very few of us know how long we'll live (and how long our money will need to last). Is 75 old? Half of 75 year olds will live another decade, and about 10% will live another 20 years. Ya gotta plan for that.
 
You could be right, in that when I myself get to 75 which is a mere 15 years from now, I would look at my stash being shrunken to 1/2 and be worried and not thinking the same as I do now. 75 is really not that old (we do have quite a few geezers here at that age, don't we?).

I dunno. I still think that even if I last longer into the 80s, I may be in bad enough shape that I won't care a diddly squat about my stocks or bonds. I would worry more about losing my mobility and becoming bedridden.

But one way or the other, it is not easy to die broke. Most posters here on this forum will either die earlier than they plan, or run out of things to spend money on simply because they are afraid of dying broke. The ones dying broke will do so whether they die at 60 or 90.
 
Assuming a person would blindly take the same dollar amount out of their portfolio while it has no gains for 17 years. If, instead, our retiree takes 3% out of the year-end balance for 17 years of no-growth, he would >not< be down to 49% of his starting portfolio, he'd be down to 60% (or, to put it more appropriate term, it is now 20% larger). Yes, his annual withdrawals would have gradually decreased in size by 40%, but he's had almost 2 decades to accommodate that decrease in available spending, as it happened at 3% each year.
Those are great comparisons - both time for dealing with shrinking income and
the fact that the portfolio hasn't depleted as quickly. This is the tradeoff a retiree makes when they choose one method over another.

One thing I like about using the % of remaining portfolio method, is that if a period starts with several good years, with the portfolio growing faster than inflation, one gets to have increasing income in the early years of retirement precisely when it might be much more fun to use that extra income as one is generally younger, healthier and more active.

But to use this method, one must have a lot of discretionary spending that could be cut out of the annual budget if needed during years when the portfolio shrinks. And while its true that in general one might only deal with such a situation for one or two years in a row before recovery, there could be periods where income gradually shrinks (in real terms) for many years in a row.

In my case, the income from the portfolio has been growing faster than our natural spending, so it's been easy to set aside unspent funds for possible needs in the near future, insulated from market volatility. It's something I had planned to do anyway, thinking of it as a form of "income smoothing" to counteract the volatility in annual income from a method tied to annual portfolio value. I also know any year now there could be a drastic drop in the portfolio value, and I have to deal with reduced income. After a year like 2008 income could drop by 30%!

Conversely, with the inflation adjusted SWR method, real income stays constant during the good years the portfolio increases, meaning the portfolio grows during those years which provides protection for future years of a bad market fun. That's fine too, it's just a different approach and a good one if someone has a lot of fixed expenses and not much flexibility or has difficulty dealing the the concept of annual income dropping suddenly in the future.

And I certainly understand why the Clyatt 95% rule would be an appealing tradeoff as it provides a form of income smoothing to deal with down years, and it has been well studied. I haven't adopted it purely for simplicity reasons, as I feel like I can handle the more drastic drops in annual income if/when they occur. I suppose I think I would feel more financially secure with accepting a drastic drop in income up front after a bad year, rather than ratcheting down using a 95% rule. It's all a matter of personal taste and psychology.
 
During the period of 1966-1983 where both stocks and bonds gave no returns over the course of 17 years (-1% cumulative for stocks, +3% cumulative for 3-month T-bill, and -24% for 10-year bonds), whatever one spent came out of his principal. The more he spent, the faster he depleted his stash.

When one is eating his seed corn for 17 years, it can't feel very good. The only way to conserve your corn is to eat less. One feels like a squirrel eating his stash of nuts for a long winter of 17 years.


PS. One positive thing that comes from not retiring very early is that our SS benefit is higher, and we can live OK on that if we take it at FRA or later.

SS may be cut, but as we should not be depleting our own stash and still have it to supplement SS, we will do OK. I just will not see my stash grow to the sky, the way those fortunate FIRECalc runs take off as rockets to the top right corner of the chart.

In short, I am not going to be living in a class C RV, except for extremely dire conditions. But by then, NM state parks would be crowded with these RVs, and I will have a lot of company to party with. :)
 
Last edited:
Audrey,
In a recent post (here) , you mentioned that maybe a 4% withdrawal rate might be a bit conservative if it is paired with this portfolio valuation-weighting approach. I thought that might be the case, too, but as it turns out, 4% is probably not far off.

Assumptions: 30 year window, AA of 50% total market, 50% 5yr Treas.

Withdrawal method: a fixed percentage of each end-of-year portfolio value, no Clyatt 95% rule used

WR..........% of cases ending above real starting value.........Avg portfolio ending value
4%..............................54%................................................112%
4.1%...........................49%................................................108%
4.2%...........................44.8%..............................................105%
4.3%...........................41%.................................................102%
4.4%...........................41%.................................................98%

So, if we are using the "portfolio weighting" method, it would seem safe and appropriate to pick an annual WR that aims for the "center" of the expected distributions of the data set we are weighting to. If we pick the mean end portfolio value to represent that, then a WR of about 4.35% would be about right. If we want the median (just as many "failed" cases as successful ones), then a 4.1% rate looks about right.
There's probably way too much implied precision in the WRs suggested above based on our data set. I'd probably use approx 4.25% (again--after doing the weighting calculations every year) and feel pretty good about it. Or, use age-based WR numbers (Guyton, SAFEMAX, etc). Just the fact that we're calculating withdrawals based on end-of-year values will help assure that the portfolio won't grow to the sky or crash entirely.
Thanks again.

Yeah - I've been running running several scenarios and I see that 4.25% seems to be about the point where your average ending portfolio just barely above your average beginning (103%). Same allocation as yours. Worst case ending portfolio value was 52% over all runs from 1871.

I have been looking at the 1966 run as well for various withdrawals rates. I used this because in all cases it looks like it's still gives the lowest real portfolio value. In those cases, 4.25% of remaining portfolio draw would have the portfolio drop to 46% of initial value in real terms. This, of course, is the truly terrible nightmare run.

Looking at the withdrawal range I've been using, 3.25% to 3.33%, you're generally looking at a real portfolio drop to 53.6% go 54.3% worst case (1966) scenario, lowest ending portfolio value around 70% of the original real, and average ending portfolio value around 140% of original real.

I must say I'm very impressed with the Clyatt rule, at least with 50/50 portfolio, because using that rule just slightly underperforms the % of remaining portfolio method with a really small difference in term of ending portfolio and just a slightly smaller worst case drop. For example, using the Clyatt rules with for 4.25% withdrawal, lowest ending portfolio value is 51% instead of 52% of original value, and average ending portfolio value is around 101% instead of 103%. Worst case drop with a 1966 run is 45.7% versus 46.0%. So for some limiting in (nominal) income drop year after year, you aren't paying that much in terms of long-term portfolio outcome.

Interestingly, in the 1966 run case the Clyatt rule is rarely invoked, because in most cases, the portfolio is not more than 5% below the prior year in nominal terms. It finally does come in to play after the market crash of 1974, but results in just a slight difference in real final portfolio value (77.9% or original versus 78.4% without Clyatt rules) after 30 years.

Note to folks not that familiar with FIRECALC and the %remaining portfolio model with or without the Clyatt rules: Note that in the scenarios above, the ending portfolios don't go to zero like several cases do with constant spending (withdrawal) model. They don't even go below 45% of original, adjusted for inflation, even in the dreaded 1966 case, and on average, you end up with where you started, or better, after 30 years, even after inflation. And the worst cases for ending portfolio after 30 years aren't close to zero either - they are just above 50% real for the 4% and 4.25% withdrawal cases. The more conservative withdrawal rate of 3.3% gives you lowest ending portfolio in real terms of 70% of the starting value and average ending portfolio value of 139%.

In contrast, for the constant spending (withdrawal) model of 4%, the portfolio goes to zero in a few cases, the fastest after 27 years. The average ending portfolio is 115% of the original portfolio, compared to the 4% of remaining portfolio with average ending value of 112%. And the largest ending portfolio is 447% of initial portfolio in real terms, while the largest ending portfolio for the 4% of remaining portfolio is just above half of that at 244%. This is because whenever the portfolio grows faster than inflation, withdrawals grow faster in the % of remaining portfolio case which reduces the ending portfolio size.
 
Last edited:
Very interesting (and long) thread ...

I believe a mix of stocks, bonds, SS and other income sources is the right one for retirement or semi-retirement and those might be rental income, part time work, annuities, TIPs, CDs or pensions. Some of these might reduce potential retirement income, but come with a lot less volatility than stocks and bonds so you can stop worrying about the stock and bond markets quite so much.

... I don't think one should make a blanket statement about the right amount of risk. And a lot depends on one's overall portfolio size. The larger the size the less risk matters.

Most people would reduce risk if possible...

I am not convinced that "most people would reduce risk if possible". Based on many of the comments on some of the recent polls, I get the impression that many people have AA's containing a large % in equities (remainder mostly bonds) and do not hold much in CDs/cash, rental income, etc. Of course, the polls do not mention total portfolio size so it is possible all these posters have a relatively smaller portfolio size (but I somehow doubt that is the case).

I also wonder if anyone has any data showing what the best/highest 5-year federally insured CDs [ideally with a short term early withdrawal penalty] would have returned over the years (which may only go back 20 or so years). I found a site that showed "average" 5 year returns (Historical CD Interest Rates 1984-2016 - Bankrate). But it does not show highest (which can make a big difference in an historic analysis of portfolios containing a blend of CDs as an income floor). So, for example, in 1984 it shows average return of 11.54% which may not be far from highest - but in 2014-2016 it shows average return of only about .86% when one can find 3% CDs (far outperforming treasuries).
 
My approach is to discount current markets back to a level that represents the median valuation of the data set used to originally calculate your SWR. If you're using FIRECalc and PE-10, that would mean discounting the current equity market down to a valuation of about 16x from it's current 24x (a 33% haircut).

I'd also do the same thing with the bond market. 10-year treasuries are yielding 1.74% versus a median of 3.89%. Using an average bond market duration of about 6 years, that 200bp lower current yield results in a price discount of about 12%.

So assuming a 1MM portfolio and a 50/50 asset allocation, I'd mark the $500,000 in stocks down by 33% to $333,000 and the bond allocation down by 12% to $440,000.

My resulting $773,000 portfolio puts me right in the middle of the valuations used in our historic data set. Applying a 4% SWR, I get a withdrawal of about $31,000.

That means my undiscounted portfolio can support a withdrawal rate of 3.1%. Said another way, a 3.1% withdrawal today is equivalent to a 4% withdrawal at median valuations.


Very thoughtful and helpful. Gives me comfort that a 3 percent WD rate on a 50/50 portfolio should produce results similar to 4 percent initiated during normal market valuations. So, if Shiller is right (and I am a big fan of Shiller), then I can still retire in the next year or so and take that 3 percent if needed.

This assumes a 50/50 portfolio. What result for a 60/40 equity/debt AA? 65/30/5?
 
Gone4Good has not logged in for almost a year. Something to do with his screenname?

Well, maybe not. He was gone before for a couple of years, then came back for a while before disappearing again. :)
 
Gone4Good has not logged in for almost a year. Something to do with his screenname?

Well, maybe not. He was gone before for a couple of years, then came back for a while before disappearing again. :)

His blog hasn't been updated since January of 2016 and the last entry on his Facebook travels log was in June. Maybe this time he really is who he says he is...
 
Gone4Good has not logged in for almost a year. Something to do with his screenname?

Well, maybe not. He was gone before for a couple of years, then came back for a while before disappearing again. :)
I checked his Facebook/website and he has not posted there either for a while. I hope all is well. I like his pictures.
 
Back
Top Bottom