Kitces: Preparing for Lower Long-Term Returns

This is why I plan to stay with my company that provides a pension for the rest of my career.

The pension may be the only way I can make ER viable given my non-impressive income.
 
This is why I plan to stay with my company that provides a pension for the rest of my career.

The pension may be the only way I can make ER viable given my non-impressive income.


I had a similar plan, but Megaconglomocorp had a different plan...

As for WR, I'm only on month two of FIRE, but my plan for the first few years is to take 4% in flat or good years, and dividends/interest only in down years. Once SS and DBP come on line later this year, my bare-bones, unclemick (minus the fish camp) lifestyle will be covered, so in down years, I'll just have to ratchet down a bit on the fun money.

Still, hanging around the house, entertaining myself, is better than having a j*b!
 
I had a similar plan, but Megaconglomocorp had a different plan...

I have a public pension. I'd rather that than a private Megacorp pension because i feel it's safer from "changes". At least the unions an myself can lobby the politicians to protect it.
 
I have a public pension. I'd rather that than a private Megacorp pension because i feel it's safer from "changes". At least the unions an myself can lobby the politicians to protect it.
It also helps that politicians have public pensions, too. :tongue:
 
bonds and dividends

Seems silly I don't know - but I was looking at year end tax stuff and I had never realized that bond funds also pay a dividend. I had thought that was just stocks.

When people talk about lower long term bond yields of 1-2% I'm assuming that includes the dividend? Is that right?

Thanks
 
Seems silly I don't know - but I was looking at year end tax stuff and I had never realized that bond funds also pay a dividend. I had thought that was just stocks.

When people talk about lower long term bond yields of 1-2% I'm assuming that includes the dividend? Is that right?

Thanks

Bond interest and bond fund "dividends" are taxed the same - as ordinary income. Mostly the fund "dividend" is just an accumulation of bond interest payments.

And yes, "yield" includes those dividends.
 
Depends on the bond.

Some bonds pay out regularly .... "Clipping coupons" as vernacular is the bond payment.

Other bonds are zero coupon and the interest earned is bundled and given when the bond matures.

Tax treatment on bonds is "interest" and taxed as "ordinary" income

Dividends receive a preferential tax treatment, at least as of today's tax code, at 15% ...and for some an additional 3.8% due to additional obamacare tax
 
I don't really care about low bond interest rates. My pension, which covers half our spending represents my notional FI AA. Now equity returns do matter to me. Makes sense that they would be lower if the risk free interest rate is also lower. So to be safe I have generally just taken dividends from my nestegg. In the end though future returns are unknown. It's the actuals that count. Still seems fairly safe to start at 4% WR and then adjust according to experience.
 
Seems silly I don't know - but I was looking at year end tax stuff and I had never realized that bond funds also pay a dividend. I had thought that was just stocks.

When people talk about lower long term bond yields of 1-2% I'm assuming that includes the dividend? Is that right?

Thanks

Bonds pay dividends. CDs pay interest. They are taxed the same (unless it's a muni bond).
 
I have been thinking about market valuations recently. CAPE10 is at 27!, and although 10-year treasuries have backed up to 2.25%, they are still about 150bp from median.

It was good to read this again - especially Gone4Good's portfolio discounting model for a withdrawal rate sanity check.
 
Last edited:
I have been thinking about market valuations recently. CAPE10 is at 27!, and although 10-year treasuries have backed up to 2.25%, they are still about 150bp from median.

It was good to read this again - especially Gone4Good's portfolio discounting model for a withdrawal rate sanity check.
Audrey,
In a recent post (here) , you mentioned that maybe a 4% withdrawal rate might be a bit conservative if it is paired with this portfolio valuation-weighting approach. I thought that might be the case, too, but as it turns out, 4% is probably not far off.

Assumptions: 30 year window, AA of 50% total market, 50% 5yr Treas.

Withdrawal method: a fixed percentage of each end-of-year portfolio value, no Clyatt 95% rule used

WR..........% of cases ending above real starting value.........Avg portfolio ending value
4%..............................54%................................................112%
4.1%...........................49%................................................108%
4.2%...........................44.8%..............................................105%
4.3%...........................41%.................................................102%
4.4%...........................41%.................................................98%

So, if we are using the "portfolio weighting" method, it would seem safe and appropriate to pick an annual WR that aims for the "center" of the expected distributions of the data set we are weighting to. If we pick the mean end portfolio value to represent that, then a WR of about 4.35% would be about right. If we want the median (just as many "failed" cases as successful ones), then a 4.1% rate looks about right.
There's probably way too much implied precision in the WRs suggested above based on our data set. I'd probably use approx 4.25% (again--after doing the weighting calculations every year) and feel pretty good about it. Or, use age-based WR numbers (Guyton, SAFEMAX, etc). Just the fact that we're calculating withdrawals based on end-of-year values will help assure that the portfolio won't grow to the sky or crash entirely.
 
Last edited:
Just to be clear - those withdrawal rates leave you with the ending portfolio that you started with.

Is that inflation adjusted as well? If in real terms as you said, yes.

Way more conservative than the SAFEMAX approach. It's a very, very high bar for "failure".

But clearly more difficult to model as theoretically the portfolio can't go to zero. What, then, to choose for "failure"?
 
Last edited:
After reading some of the comments in this thread I made myself feel better reading Safe Withdrawal Rate for Early Retirees

I'm still concerned about the lower returns predictions over the next 9-10yrs which are crucial years for me to be FI by 50 but nothing I can do about it than just keep plugging away at it. Worst case I w*rk longer :blush:
 
I have been thinking about market valuations recently. CAPE10 is at 27!, and although 10-year treasuries have backed up to 2.25%, they are still about 150bp from median.

It was good to read this again - especially Gone4Good's portfolio discounting model for a withdrawal rate sanity check.

my bond portfolio has taken a bit of a hickey...all munis I plan on holding to maturity though
 
Holding stocks long-term is similar to holding bonds to maturity . . . you earn your current yield.

Almost, but not quite. It is the current earnings yield + future earnings growth. At a macro-level that's roughly world gdp growth, 2% - 3% typically. Bonds don't have that.

At a 24x PE, we're getting an earnings yield of about 4%. At 16x we're getting an earnings yield of 6.25%. Therefore, all else being equal, you expect to earn 200bp less from stocks today over the long term than if you bought them at median valuations.

It's rather 4% - inflation (2%) + GDP growth (2%) = 4% real. Adjust according to expectations .. of course your point stands, lower multiples imply a potential bonus.
 
Is that inflation adjusted as well? If in real terms as you said, yes.
Yes, inflation adjusted. So, a "failure" might just mean that at the end of 30 years the portfolio was just a tiny bit in real value from the starting amount.
 
Yes, inflation adjusted. So, a "failure" might just mean that at the end of 30 years the portfolio was just a tiny bit in real value from the starting amount.

I remember a few years ago when Midpack discovered this FIRECALC quirk for the % of remaining portfolio method and pointed it out.

To me that means you aren't discovering some safe withdrawal rate for the discounted median case, but rather a rate at which the portfolio would likely be self-perpetuating. Quite a different animal.

If failure was allowed to be something like dropping below 1/2 of the original value in real terms, the supported withdrawal rate would be higher.
 
Last edited:
I remember a few years ago when Midpack discovered this FIRECALC quirk for the % of remaining portfolio method and pointed it out.

To me that means you aren't discovering some safe withdrawal rate for the discounted median case, but rather a rate at which the portfolio would likely be self-perpetuating. Quite a different animal.

If failure was allowed to be something like dropping below 1/2 of the original value in real terms, the supported withdrawal rate would be higher.
And, just to clarify, the "failure" of a "% of remaining portfolio" withdrawal method method only means that the portfolio was below the real starting value at the very end of the period. It's just a snapshot at the end of the run.
But, the graphic showing the withdrawal amounts does show reference lines for the US poverty-level income for single person and two person households, though the numbers haven't been updated since 2006.

Below is the run for a $1M starting portfolio, 50% TM/50% 5yr Treas, using a 4.5% end-of-year withdrawal method. To me it looks like the overall trend of the 116 runs is slightly downward, and that there are a small but not insignificant number of case where, at some point, the real withdrawal amount dipped below $22,500 (i.e. 50% of the starting amount). Some folks might be comfortable with this, some might not.

What I haven't quite wrapped my head around:
1) This discussion is about making our withdrawals using a valuation-weighting method. The chart below shows the historical results of straight (non-valuation-weighted) withdrawals. After we apply our weighting, what would the real value of the withdrawal chart out to be? I think that they'd be more center-weighted, with fewer extreme highs and lows (because when the portfolio's value is lower, it is likely because valuations are low, and that would result in a higher effective WR during those years)
2) How would this weighted withdrawal method affect overall portfolio survival/growth? We're withdrawing a >higher< percentage of our portfolios when share prices (and also valuations, assuming earnings are less volatile than stock prices) are lower, which means an even greater number of shares are sold off during those times. That seems like a good way to prevent the portfolio from recovering when share prices revert to the mean.

Compared to a "fixed starting amount adjusted for inflation" withdrawal method, the "straight" "% of year-end portfolio value" withdrawal method does a better job of preserving portfolio value and of increasing total lifetime withdrawals, primarily because the value of the withdrawals is reduced when the portfolio (and share prices) are beaten down, and because "windfalls" are harvested if a portfolio soars. My (unproven) hypothesis is that a valuation-weighted withdrawal method, to some extent, would reduce these advantages.
line-graph.php
 
Last edited:
Thanks for the runs and comments.

Your posted graph was blank for some reason.
 
The link to the graph will not work. You need to capture the graph to a bitmapped graphics file, then post it.

I think it is going to be tough to beat the "fixed dollar amount adjusted for inflation" withdrawal method. Converted to percentage of current portfolio value, it will be low during boom years, and high during lean years. This allows surplus to be built up in good years to be spent in bad years.

The method of "fixed percentage of remaining portfolio" will not run out of money, but that's because it can choke off the withdrawal to a trickle.

The problem any method has is that a bull market can run for nearly 20 years like it did in 1983-2000, and a bear market can also be for a similarly long period. No matter what you do, you cannot squeeze money out of any investment instrument when everything just sucks.
 
It's the same approach to: how long will I live?

Statistics, history and biology can give a solid estimate, but nothing guarantees your next minute. Mind uploading at the other extreme is a fantasy right now, but inventions that seemed stranger have happened.

Take a reasonable safety buffer, and stay flexible.
 
Your posted graph was blank for some reason.

The link to the graph will not work. You need to capture the graph to a bitmapped graphics file, then post it.
Thanks, I'd forgotten about that "feature." Maybe the file below will show up.

I think it is going to be tough to beat the "fixed dollar amount adjusted for inflation" withdrawal method. Converted to percentage of current portfolio value, it will be low during boom years, and high during lean years. This allows surplus to be built up in good years to be spent in bad years.

The method of "fixed percentage of remaining portfolio" will not run out of money, but that's because it can choke off the withdrawal to a trickle.

There's obviously no perfect method that suits everyone. Some of us can't tolerate much variation of our annual withdrawals, while others can accommodate it (due to existing pensions, SS provides a high percentage of our "must have" essential spending, etc). In the case of my household, high annual variability in portfolio withdrawals can be accomodated, and "% of year end value" method helps to assure that the portfolio will survive to provide income for a lifetime and doing things this way generally results in greater lifetime withdrawals

Hybrid approaches will appeal to many.
- Straight % of year end value modified by Clyatt's 95% rule
- Audrey's "put extra aside for a rainy day" method
- VPW
- Professor Gummy's "extra's method" (described here, but in a nutshell in a post by MasterBlaster:
On a related topic, there was a link (from poster Charlie) to Gummy-stuff's website yesterday that discussed a withdrawel plan where you took a 3% SWR that was augmented with some percentage of your portfolio gain over the inflation rate (ie. 50%). Basically you only take extra money out when the portfolio exceeds that for a 3% SWR plus inflation. The survival rates were the same as using a 4% SWR.

sensible withdrawals

This approach gives you (on average) a better income stream early in your ER and then it declines with time but never below the 3 % rate. Most ER's could use more cash early rather than later.

Did any of you see this ? What is your reaction ? It looks intriguing to me.

A Traditional 4% SWR on a million dollar portfolio would give you a constant $40k income adjusted for inflation. The Gummy-stuff approach gives you an initial expected income of $62k (inflation adjusted) or so declining to ~$37k (inflation adjusted) as you approach year 40 of ER with the longevity performance the same as the (safe) 4% withdrawal rate.
 

Attachments

  • snapshot.jpg
    snapshot.jpg
    187.5 KB · Views: 81
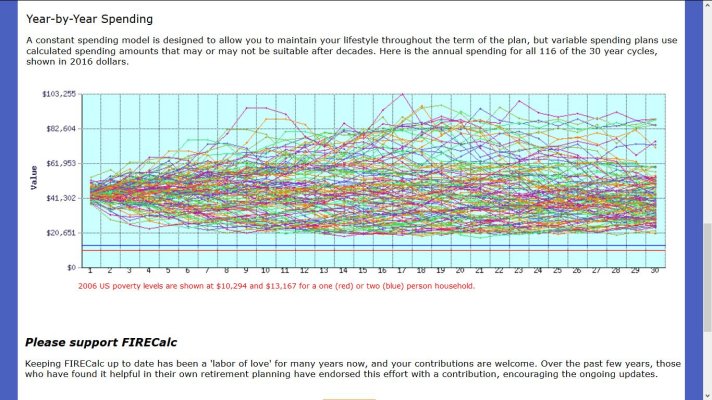
... Below is the run for a $1M starting portfolio, 50% TM/50% 5yr Treas, using a 4.5% end-of-year withdrawal method. To me it looks like the overall trend of the 116 runs is slightly downward, and that there are a small but not insignificant number of case where, at some point, the real withdrawal amount dipped below $22,500 (i.e. 50% of the starting amount). Some folks might be comfortable with this, some might not.

attachment.php


Starting with drawing $45K from a $1M portfolio, this graph shows that in the worst cases, you will not be broke but stay hungry for decades living on just $20K.

And if you have $3M, you can get $60K, then have to live on what's left after taxes and healthcare. Can we all say "class C RV parked on New Mexico state land"?

In the best cases, you are fat and happy with spending in the $80K+ for decades, from the same $1M initial portfolio.

Such are the vagaries of market return!
 
Starting with drawing $45K from a $1M portfolio, this graph shows that in the worst cases, you will not be broke but stay hungry for decades living on just $20K.
Right, but:
- This is 4.5%, not the "standard" 4%. So, a "heftier" starting WR than most people count on
- The vast majority of portfolios stayed fairly close to the starting value, and annual withdrawals stayed generally close to the central starting value. Things are a lot different if instead we use "starting amount adjusted for inflation" methods:
-- High side: Only about 5 of the 116 runs "exploded", with ending values double (or more) the size of the starting value (leaving tons of money unspent by the retiree). In general, portfolios that did well returned the $$ to the retiree as withdrawals. However, using a fixed 4.5% of starting value adjusted for inflation method, about 15 portfolios ended up "exploding (ending value at least twice as high as starting value).
-- Low side: Some of the portfolios (15%?) had long periods of providing about 1/2 of the starting withdrawals for extended periods. I'd bet these are the same ones that would have crashed entirely (zero balance) if we'd used a "4.5% starting withdrawal adjusted for inflation" withdrawal method. That produced a 23% failure rate. And these failures are really failure--a dead-broke zero-value portfolio. The "% of end-of-year balance" withdrawal method has a much more forgiving "failure" mode.
No matter which method a retiree uses, occasional "reality checks" will be needed to assure things aren't headed to the sky, or the toilet.
 
Last edited:
Back
Top Bottom