Long term S&P vs EAFE

Delawaredave

Recycles dryer sheets
Joined
Apr 9, 2005
Messages
184
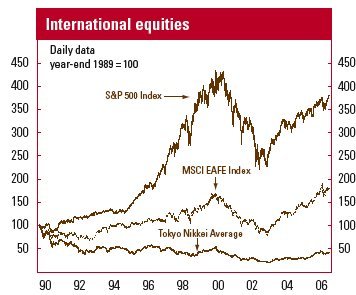
Every time I get Vanguard newsletter, I ponder about the chart comparing 16 years of S&P vs. EAFE (posted below, if I can, otherwise here is link)

Moderator edit: Shorter link to shrink the post margins.

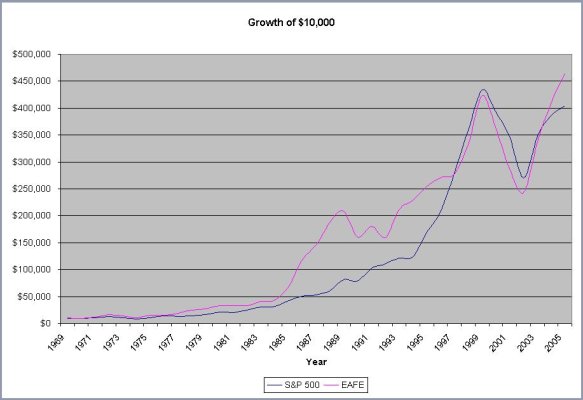
I thought over long, long term, S&P and EAFE grew about the same.

If that's true, looks like there's a huge divergence between S&P and EAFE over last 15-16 years.

What happens over next 15 years ?
1. Will they both regress-to-mean and 15 years from now be around same point ?
2. Will the world economy grow even faster than US and have EAFE eclipse S&P ?
3. Will the US continue to kick butt against world economies and get even further ahead ?
 

Attachments

  • sp eafe jpg.jpg
    sp eafe jpg.jpg
    27 KB · Views: 30
  • sp eafe jpg.jpg_thumb
    25.8 KB · Views: 0
Might want to check out a longer-run than 1990-2005. See attachment below for Growth of $10,000 from 1969-2005. You'll notice that the MSCI EAFE was really beating the S&P 500 up in the 1980's, but that turned around in the 1990's.

- Alec
 

Attachments

  • SPEAFE.JPG
    SPEAFE.JPG
    59.9 KB · Views: 31
  • SPEAFE.JPG_thumb
    9.8 KB · Views: 0
Guys, I have two questions:
- What currency are these numbers in? And how are they adjusting the changes in currency exchange rates?

- Do these charts include reinvested dividends, taxes, and trading costs?
 
Nords said:
Guys, I have two questions:
- What currency are these numbers in? And how are they adjusting the changes in currency exchange rates?

- Do these charts include reinvested dividends, taxes, and trading costs?

The returns I've got for the S&P 500 and MSCI EAFE came from Jeff Troutner at TAM. The S&P returns come from Ibbotson and S&P, and are total return. The MSCI EAFE returns are total return, gross dividend, in US $.

They don't include any taxes, expenses, trading costs, etc.

- Alec
 
Nords said:
Guys, I have two questions:
- What currency are these numbers in? And how are they adjusting the changes in currency exchange rates?

- Do these charts include reinvested dividends, taxes, and trading costs?

1. Index returns NEVER include trading costs because technically they aren't investable

2. If you find a way to include trading costs there are several large business schools with even larger endowments who would love to give you a job
 
Delawaredave said:
What happens over next 15 years ?
1. Will they both regress-to-mean and 15 years from now be around same point ?
2. Will the world economy grow even faster than US and have EAFE eclipse S&P ?
3. Will the US continue to kick butt against world economies and get even further ahead ?

A few comments...

1) If you can answer your questions 1,2,3 you can decide where to invest and how to make yourself wealthy. My advice is to not even try to answer those questions because nobody can tell you the answer. Have a diversified portfolio and ride out whatever comes along.

2) The vertical axis on those charts should be on a log scale. If that was the case then you'd see that the EAFE has been beating the pants off of the S&P500 since 2000. In other words take the US stock bubble out of the picture and the conclusion you get is quite different.

3) As others have pointed out, the direction of the US $ has a very big impact on these comparisons. So add to your list of questions... Where will the US$ trade 15 years from now ?
 
Back
Top Bottom