Minimum rate of return in retirement

Samsung4321

Recycles dryer sheets
Joined
Nov 12, 2021
Messages
376
I calculate nominal minimum rate of return in retirement thus:


= (1 + RATE((AgeDie-AgeRetire), AnnualWithdrawal, -CapitalRetire, 0, 0)) * ( 1 + Inflation%) - 1


That after deducting capital in home and capital assigned to age care.


If rate of return is infeasible then AnnualWithdrawal is infeasible.


If rate of return is improbably small then AnnualWithdrawal is probably too small.


Example:

= (1 + RATE((92-67), 40000, -4000000, 0, 0)) * ( 1 + 3%) - 1
= -5.9%
 
delete
 
I don't really get the purpose of this rate, but a $40,000 annual withdrawal on a $4,000,000 retirement portfolio is much lower than typical.

On second thought, it looks like you may be trying to calculate that annual rate of return for aspecified WR for 30 years... I've done that before and got 4.05% for a 4% WR.

WithdrawalBalance
Inflation3.00%
Nominal return4.05%
0100.00
14.00100.05
24.1299.97
34.2499.77
44.3799.44
54.5098.96
64.6498.33
74.7897.53
84.9296.56
95.0795.40
105.2294.04
115.3892.47
125.5490.67
135.7088.63
145.8786.35
156.0583.79
166.2380.95
176.4277.80
186.6174.34
196.8170.54
207.0166.38
217.2261.84
227.4456.90
237.6651.54
247.8945.73
258.1339.45
268.3832.67
278.6325.36
288.8917.50
299.159.06
309.43(0.00)

With a 1% WR it would be -3.83%.
WithdrawalBalance
Inflation3.00%
Nominal return-3.83%
0100.00
11.0095.17
21.0390.50
31.0685.97
41.0981.59
51.1377.34
61.1673.22
71.1969.22
81.2365.34
91.2761.58
101.3057.91
111.3454.35
121.3850.89
131.4347.52
141.4744.23
151.5141.02
161.5637.89
171.6034.84
181.6531.85
191.7028.93
201.7526.07
211.8123.27
221.8620.51
231.9217.81
241.9715.16
252.0312.54
262.099.97
272.167.43
282.224.93
292.292.45
302.36(0.00)
 
Last edited:
@Samsung4321 welcome! The calculation seems unnecessarily complicated.

As mentioned above, calculate a withdrawal rate, WDR. If WDR rate is less than 4%, you have a sustainable situation.
 
I calculate nominal minimum rate of return in retirement thus:


= (1 + RATE((AgeDie-AgeRetire), AnnualWithdrawal, -CapitalRetire, 0, 0)) * ( 1 + Inflation%) - 1


That after deducting capital in home and capital assigned to age care.


If rate of return is infeasible then AnnualWithdrawal is infeasible.


If rate of return is improbably small then AnnualWithdrawal is probably too small.


Example:

= (1 + RATE((92-67), 40000, -4000000, 0, 0)) * ( 1 + 3%) - 1
= -5.9%

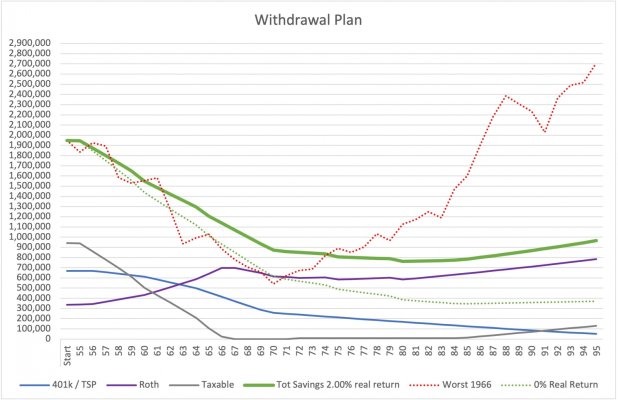
I do a similar calculation. But it's mostly out of curiosity. Using an average rate over a long retirement can be misleading. The graph below has:

1. Average real return of 2%
2. Average real return of 0%
3. Historical worst sequence

It is interesting that the first part of the historical worst tracks the 0% real line pretty closely at the beginning of retirement. But the markets don't stay down forever, so the historical worst scenario returns to growth while the 0% scenario continues to decline.

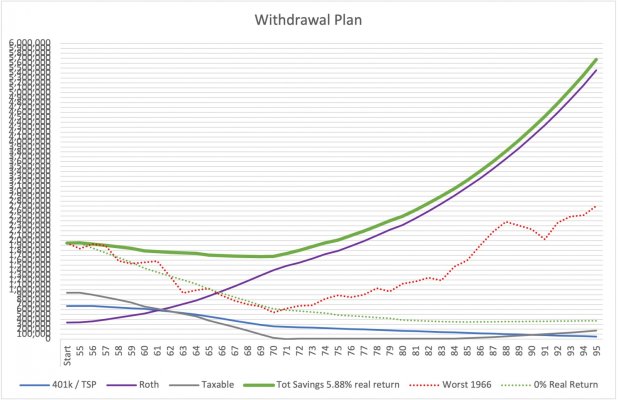
Guess what the average return for the historical worst sequence is? 5.88%. If you put an average return of 5.88% real for my retirement, I am rich! Gotta watch out for sequence of returns risk.

Below:

First one is 2% real return for my plan
Second one is 5.88% real return for my plan (I hope that's how it goes)
 

Attachments

  • Picture1.jpg
    Picture1.jpg
    328.1 KB · Views: 129
  • Picture1-2.jpg
    Picture1-2.jpg
    401.8 KB · Views: 114
No matter what you compute, when a bad SORR - Sequence of Return Risks - hits, all bets are off. :)
 
Starting back in 2010, I ran a calculation in Excel, to see what kind of return I'd have to make, to keep from ever running out of money. It was based on my invested assets at the time, spending $3,333/mo ($40K per year), and I ran it out to April 2070, which is when I would hit 100...presuming I lived that long. The idea of the spreadsheet was to get the April 2070 balance down to as close to zero as possible...you know, the old check of making sure the check to the undertaker bounces.

I started this back in September of 2010. At the time, I had about $537K saved up. So for that to throw off 40K per year, I would've had to make 7.41% per year. Now this doesn't take inflation into account, so that would have to be, 7.41% above inflation. And, in the real world, nobody has the same, consistent return year after year. But, it was just a little exercise. And it doesn't take SS into consideration. But, I wanted to see how that number would change, as I aged, built up a larger nest egg, and had fewer years to plan for.

From 2011 onward, I tried to always run the number based on my balance as of April 1. On 4/1/2011, I had $660K, so the rate of return needed was down to 5.91%.

Over the years, the spreadsheet became less relevant. Part of it was that I knew I'd need a lot more than $40K per year to live off of. But, I still update it once a year, just to see how that percentage goes down. For 4/1/2021, something interesting happened. My invested assets were at $2,324,406, and I was still assuming $3333/mo. Well, for the first time, I calculated I could actually lose a bit every month, and still not run out of money. I calculated that if I consistently lost 0.6% per year, spread out evenly over every 12 months, I'd still have a bit left when I hit 100.

At the end of the day though, it's a pretty useless exercise, and doesn't really predict anything but the obvious...the more you make, the less likely you are to run out of money!
 
At the end of the day though, it's a pretty useless exercise, and doesn't really predict anything but the obvious...the more you make, the less likely you are to run out of money!

I used to worry about this, but thanks to my (everyone's?) lucky star, with the market return in the last few years and also my sliding down the Bernicke's slope plus SS, my WR is now less than 1%.

I still like to see my stash grows though. It's fun.
 
... it looks like you may be trying to calculate that annual rate of return for aspecified WR for 30 years... I've done that before and got 4.05% for a 4% WR.

Purpose is to estimate minimum nominal rate of return which, for a specified time, will support a specified ratio of withdrawal rate to capital.


Can be done as you have or using a single spreadsheet formula as in my example.
 
@Samsung4321 welcome!
Greetings.


The calculation seems unnecessarily complicated
It succinctly uses spreadsheet function RATE. Other useful functions are PMT, PV, FV, NPER, ... .


As mentioned above, calculate a withdrawal rate, WDR. If WDR rate is less than 4%, you have a sustainable situation.


A withdrawal rate of 4% for 25 y with 3% inflation requires a minimum nominal return of 3%:

= (1 + RATE((92-67), 4%, -1, 0, 0)) * ( 1 + 3%) - 1
= 3.0%
because a real return rate of 0% results in no earnings and all capital being withdraw after 25 y.
 
Gotta watch out for sequence of returns risk.
First one is 2% real return for my plan
Second one is 5.88% real return for my plan (I hope that's how it goes)


Withdrawal amount / rate? Flat '0% Real Return' line after 84 implies 0%?
 
No matter what you compute, when a bad SORR - Sequence of Return Risks - hits, all bets are off. :)


Adverse SORR results in a small average rate of return. Between the start and end points can be much 'Irrational Exuberance' and 'Desperate Despair'.
 
it's a pretty useless exercise, and doesn't really predict anything but the obvious...the more you make, the less likely you are to run out of money!


It calculates the minimum nominal rate of return required for the inputs given. The prediction part is in the inputs.
 
Adverse SORR results in a small average rate of return. Between the start and end points can be much 'Irrational Exuberance' and 'Desperate Despair'.

The worst time to retire was 1966. The 30 year average real return for the 40 years following 1966 was 5.88%. The sequence of the returns is much more important than the average. This has been hashed out ad nauseam.
 
The worst time to retire was 1966. The 30 year average real return for the 40 years following 1966 was 5.88%. The sequence of the returns is much more important than the average. This has been hashed out ad nauseam.

I think you are referring to the real Compound Annual Growth Rate (CAGR) for period from 1966 to 1996:

= 1 * (1 + 5.88%) ^ 30
= 5.552

GACR is:
= (5.552 / 1) ^ (1 / 30) - 1
= 5.88%

CAGR is not the average of the annual returns. It is the PRODUCT of each (annual return + 1) [which is not dependant on sequence].

The purpose of calculating the minimum nominal rate required is to raise a wet finger into the stream of likely / possible rates of return to test the reasonableness of the assumed / predicted inputs on which the calculation is based.

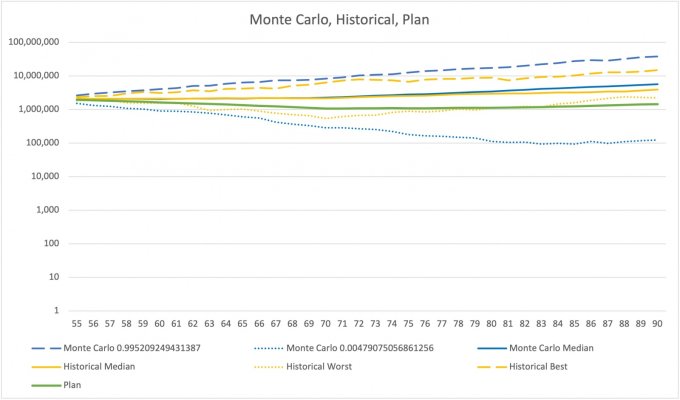
To me it is the least interesting of all my calculations. My model uses historical returns, Monte Carlo, variable withdrawal rate and average real returns. The mosaic that paints helps me determine how I am doing. To be honest, I could care less what my average return is over 40 years. It's not relevant.

I like looking at this chart. It shows the output of my historical model, Monte Carlo model and my plan. I feel comfortable that my plan line is pessimistic.
 

Attachments

  • Picture3.jpg
    Picture3.jpg
    214.9 KB · Views: 85
Greetings.


It succinctly uses spreadsheet function RATE. Other useful functions are PMT, PV, FV, NPER, ... .


A withdrawal rate of 4% for 25 y with 3% inflation requires a minimum nominal return of 3%:

= (1 + RATE((92-67), 4%, -1, 0, 0)) * ( 1 + 3%) - 1
= 3.0%
because a real return rate of 0% results in no earnings and all capital being withdraw after 25 y.

@Samsung4321 OK, what's next?
 
shows the output of my historical model, Monte Carlo model and my plan.


All helpful in the face of the known unknowable.


The point is that calculating / estimating the minimum nominal rate of return helps with estimating how much risk must be taken. As does simulation using randomised past returns.
 
I think you are referring to the real Compound Annual Growth Rate (CAGR) for period from 1966 to 1996:

= 1 * (1 + 5.88%) ^ 30
= 5.552

GACR is:
= (5.552 / 1) ^ (1 / 30) - 1
= 5.88%

CAGR is not the average of the annual returns. It is the PRODUCT of each (annual return + 1) [which is not dependant on sequence].

The purpose of calculating the minimum nominal rate required is to raise a wet finger into the stream of likely / possible rates of return to test the reasonableness of the assumed / predicted inputs on which the calculation is based.


Samsung4321:

We are not able to figure out what you are trying to ask the group or tell the group, so maybe some more background on what you are trying to do would help. If you are just getting started thinking about retirement analysis, you may want to look at the FireCalc.com calculator as it has a long dataset of historical returns and flexible input regarding income and expenses. It can illustrate the sequence of returns issue that others have pointed out.

Specifically, Corn18's point was that the returns starting in 1966 look pretty reasonable, until you look at the sequence. Sequence matters because you have to eat every day, so are making withdrawals as you go. Great returns after you're broke are meaningless.

Bengen's famous study for Trinity University ~1994 showed that 4% of the original balance (inflation adjusted) was the maximum you could withdraw in the worst case historical period for a 50/50 portfolio and not go broke. Increasing equity allocation didn't help much and high equity allocations actually hurt.

A couple years later, the 30 year period starting in 1966 was complete and that turned out to be even worse than anything Bengen had available in his original dataset. Despite a huge bull market that started in 1982, the 1966 retiree was already doomed as the portfolio had depleted too much and store only takes $ not %.

The general idea of a safe withdrawal rate (SWR) a bit below 4% has held up well over the years, though the future can always surprise.

There are many threads here on the subject. Another good resource for data, analysis and engaging writing is the Safe Withdrawal Rate series at EarlyRetirementNow.com
 
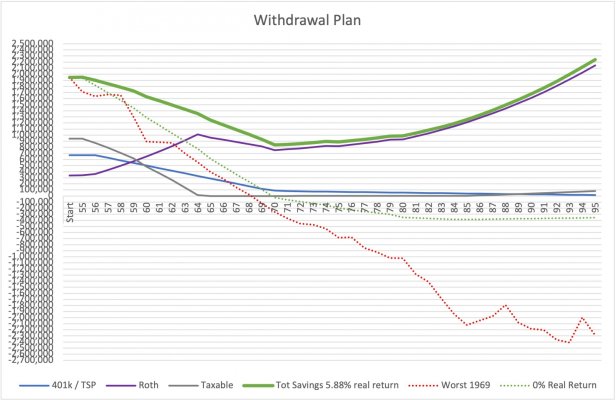
This is the best illustration of SORR I can come up with. Worst year is 1969 for this scenario for SORR. I used 5.88% real for my plan which is the average real return from 1969-2009 (40 years). Notice how using the average looks ok. But dang, you got murdered from SORR and were broke by 68. Hope you have some rich kids.
 

Attachments

  • Picture1.jpg
    Picture1.jpg
    390.7 KB · Views: 64
Back
Top Bottom