Monte Carlo used over a period of time

chassis

Full time employment: Posting here.
Joined
Aug 2, 2020
Messages
682
I searched this site and didn't find a similar thread.

Has anyone here used Monte Carlo tools, for example portfoliovisualizer or others, as a planning tool for a period of time, for example 10 years? Did your view of Monte Carlo become more favorable, or less favorable over time, in terms of the usefulness of MC as a planning tool?

I am not referring to "period of time" in the sense of the number of years parameter in the MC simulation. "Period of time" means calendar years that you have personally used MC in your own planning toolbox.

We all know the pitfalls of thinking the future can be predicted with a fancy calculator like MC. However I do believe in robust data sets and robust analytical methods. MC could be one of those - a robust data set and a robust method.

What do people think about MC, after having used it for 10 years? Thanks for any comments.
 
I haven't used Monte Carlo simulations for 10 years, but do use the Fidelity Retirement calculator on a regular basis, which uses a MC methodology.
I think there is value for MC calculations, but on the whole it usually produces more conservative results than historical based calculators.
A main reason for this result is that for example it can use the bear market of 2000 followed by the bear market of 2008. This concept is not truly realistic based on history and the concept of reversion to the mean.
 
Monte Carlo is definitely more conservative than reality so if a Monte Carlo analysis looks favorable, you can probably relax.
 
I’ve used Monte Carlo simulators for many years and believe they are a powerful planning tool. The criticism of them is that they do not reflect the market’s tendency to return to its average valuation. That is, the worst market performance in the MC simulations will string together 30 years of poor returns and the best simulations will string together 30 years of exceptional returns. We have not seen bull or bear markets in the US like this yet, but other countries certainly have seen something close. If one ignores the best and worst predictions, the MC simulations can be fairly accurate. I always combine the results with those of historical calculators to get a more complete view of the range of possibilities for my portfolio’s performance.
 
Monte Carlo helped me figure out I could safely FIRE. I support it.
 
I started my planning using MC. It was fun to see the extremes. With over 20k runs, the max (assuming I worked until 65, my ending balance could top out over a billion dollars! I ran the numbers for over 10 years, and the results were always comforting. When the failure rate was consistently below 3%, I knew I was good to go. With the discovery of this forum and FireCalc, that was the icing on the cake. With a sufficient number of runs, MC is a good tool.
 
I haven't used Monte Carlo simulations for 10 years, but do use the Fidelity Retirement calculator on a regular basis, which uses a MC methodology.
I think there is value for MC calculations, but on the whole it usually produces more conservative results than historical based calculators.
A main reason for this result is that for example it can use the bear market of 2000 followed by the bear market of 2008. This concept is not truly realistic based on history and the concept of reversion to the mean.


I didn’t know that. Thanks.
 
I've used various MC models along with FIRECalc for many years. They provide a different viewpoint from the straight historical calculators.

As folks have said, though, don't shoot for 100% in MC or you will never quit working. In most MC models, >95% success is very high confidence - similar to 100% in FIRECalc.
 
Not a fan of Monte Carlo for this type of analysis (it is very useful in other cases).

The output of MC is totally dependent upon what the programmer uses for the ranges for each variable. Seems when it is asked how these ranges are determined, the answer is they tweak them until they seem to match historical records.

Then why not just use historical records! :facepalm:

Historically, there may be some connection between things like interest rates and market returns, I don't think MC takes this into account, everything is independent, and therefore, unrealistic (IMO).

-ERD50
 
The important thing is to know the strengths and weaknesses. Average returns is most useful for tax and estate planning where you hope everything averages out.

I prefer historical to MC for answering the "can I retire question?" as momentum and reversion to the mean are real but not captured in Monte Carlo. As a result, MC produces "fat tails", overstating the likelihood of best and worst cases.

Sometimes to avoid data mining (where we have snooped the data before we make our hypothesis) or to look at long periods of time where there isn't enough history to be statistically significant, MC is the best choice.
 
I’ve used Monte Carlo simulators for many years and believe they are a powerful planning tool. The criticism of them is that they do not reflect the market’s tendency to return to its average valuation. That is, the worst market performance in the MC simulations will string together 30 years of poor returns and the best simulations will string together 30 years of exceptional returns. We have not seen bull or bear markets in the US like this yet, but other countries certainly have seen something close. If one ignores the best and worst predictions, the MC simulations can be fairly accurate. I always combine the results with those of historical calculators to get a more complete view of the range of possibilities for my portfolio’s performance.

The important thing is to know the strengths and weaknesses. Average returns is most useful for tax and estate planning where you hope everything averages out.

I prefer historical to MC for answering the "can I retire question?" as momentum and reversion to the mean are real but not captured in Monte Carlo. As a result, MC produces "fat tails", overstating the likelihood of best and worst cases.

Sometimes to avoid data mining (where we have snooped the data before we make our hypothesis) or to look at long periods of time where there isn't enough history to be statistically significant, MC is the best choice.

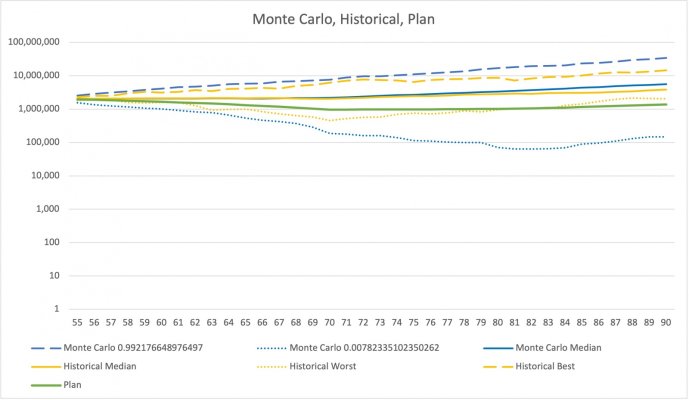
I agree with these posts. MC should not be the only tool in the tool box. The "tails" on a MC sim using historical average and standard deviation can get quite large. That's because the historical returns are not a normal distribution. That's ok, use all 3 tools and see what they spit out. I put average, historical and MC all in my spreadsheet so I can see them all at once and do a lot of what if/sensitivity analysis.

I do agree that historical is probably the best to decide if you can retire. 100% historical seems to equate to 95% MC depending on the variables. I use average returns to plan and track progress in retirement.
 

Attachments

  • current.jpg
    current.jpg
    211.8 KB · Views: 64
Thanks to all, these are helpful comments. I am a believer in robust tools and methods. Part of the definition of "robust" in my view is the use of a tool or method over a period of time. The "test of time", to borrow a phrase.

If the preponderance of evidence, quantified by frequent use of Monte Carlo simulation over a period of years, indicates FIRE is possible, then FIRE is possible. And possibly sooner than the preponderance of the evidence, owing to the likely conservatism in Monte Carlo simulations.
 
Not a fan of Monte Carlo for this type of analysis (it is very useful in other cases).

The output of MC is totally dependent upon what the programmer uses for the ranges for each variable. Seems when it is asked how these ranges are determined, the answer is they tweak them until they seem to match historical records.

Then why not just use historical records! :facepalm:

Historically, there may be some connection between things like interest rates and market returns, I don't think MC takes this into account, everything is independent, and therefore, unrealistic (IMO).

-ERD50

^ This.
 
Kind of irrelevant to use after you retired...


I looked at the results back when I was deciding to stay unemployed or look for a job... along with other options and decided I had enough....


Have not looked at any calculation since...
 
Reading this thread I went back and looked at earlier Fidelity Planner tool outputs.
8 years ago I had failure at age 90 for the periods where returns were worse than 75% of the expected.
3 years ago even the 90% worse case survived passed the 92 year old end run. The average run case said I would have less banked than is actually there at this point.
All irrelevant as:
Markets have been better than average.
Inflation has been lower than the model assumes.
My spending has been slightly lower than expected the last couple of years.
The model assumed a higher rate of inflation for health care in the 8 years ago run.
 
8 years ago I had failure at age 90 for the periods where returns were worse than 75% of the expected.


I’m trying to understand. Are you saying 75% of the time those models 8 years ago predicted success, i.e. no failure at age 90? If so, doesn’t that mean the models worked correctly since you had a 3 out of 4 chance of succeeding, and you in fact seem to be succeeding?
 
I’m trying to understand. Are you saying 75% of the time those models 8 years ago predicted success, i.e. no failure at age 90? If so, doesn’t that mean the models worked correctly since you had a 3 out of 4 chance of succeeding, and you in fact seem to be succeeding?

IIRC, one of the models that Fidelity uses is where using "average" market returns translates to meaning that the results reference what is to be expected 75% of the time. Thus a 75% confidence level.
They also have a "significantly below market performance" model which translates to a 90% confidence level.

I think Fidelity planning tool uses Monte Carlo simulation, so the extreme ends are actually not that realistic because stock market tend to revert to norm. So that 90% confidence level could be worse the actual worst case scenario.
 
I think Fidelity planning tool uses Monte Carlo simulation, so the extreme ends are actually not that realistic because stock market tend to revert to norm. So that 90% confidence level could be worse the actual worst case scenario.

This is true and I mentioned this concept in an earlier post. Some folks in general equate an approximate 5% difference in success rates between Monte Carlo sims and historical sequencing sims, with the Monte Carlo being more conservative.
There is also some leeway in programming these sims as mentioned by ERD50, so that there is effectively a push closer to an historical sequence concept.

P.S. The 75% confidence level I mentioned previously is actually with a "below market performance", not an average market performance which equates to a 50% confidence level in the Fidelity program.
Nevertheless, that is why most folks who use their program for guidance default to the Significantly Below Market scenario.
 
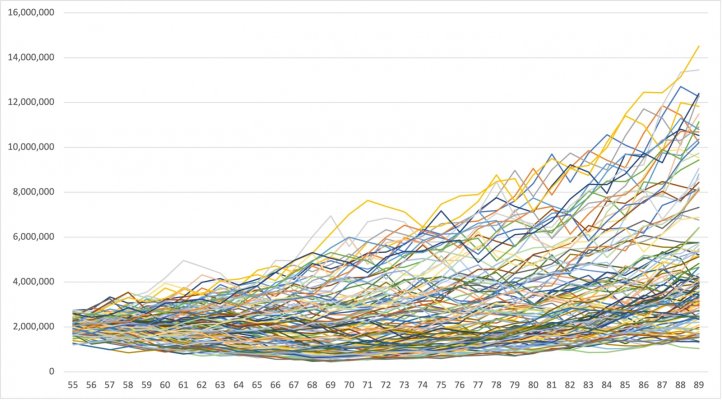
I like showing my wife the output from my historical model and telling her that our retirement will probably not look like any of those lines. Then she always points to the top one and says, "Oooh, I like that one!"
 

Attachments

  • fc.jpg
    fc.jpg
    413.9 KB · Views: 28
I like showing my wife the output from my historical model and telling her that our retirement will probably not look like any of those lines. Then she always points to the top one and says, "Oooh, I like that one!"

Is the top line from beginning year 1982?
 
I haven't used Monte Carlo simulations for 10 years, but do use the Fidelity Retirement calculator on a regular basis, which uses a MC methodology.
I think there is value for MC calculations, but on the whole it usually produces more conservative results than historical based calculators.
A main reason for this result is that for example it can use the bear market of 2000 followed by the bear market of 2008. This concept is not truly realistic based on history and the concept of reversion to the mean.

Same here and agree. Jim Otar produced a monte carlo calculator a while back that also includes long term serial correlation to capture secular trends, which most of the calculators don't do. Reading his articles, he's not the biggest fan of monte carlo either, but decided to do it anyway.

http://retirementoptimizer.com/articles/mcimca0001.PDF

Cheers.

I mucked about some with my Monte Carlo sim to try to control the tails but all I managed to do is make it match historical data. That kindof defeats the purpose of Monte Carlo. It is nice to see that I can survive 1929 followed by 2008 followed by terrible returns, but I would not recommend chasing those tails. You'll work too long and worry too much.
 
Back
Top Bottom