You are using an out of date browser. It may not display this or other websites correctly.
You should upgrade or use an alternative browser.
You should upgrade or use an alternative browser.
Overconfidence In Market?
- Thread starter JimBob
- Start date

NW-Bound
Give me a museum and I'll fill it. (Picasso) Give me a forum ...
- Joined
- Jul 3, 2008
- Messages
- 35,712
Well, the above is the opposite of modesty.
Besides, I don't know I could afford it even if I converted my whole net worth into it. Or even if I could, getting fuel for it would be a bit tough. I would be looking for fuel all the time, worse than Mad Max had to do.
Besides, I don't know I could afford it even if I converted my whole net worth into it. Or even if I could, getting fuel for it would be a bit tough. I would be looking for fuel all the time, worse than Mad Max had to do.
HFWR
Give me a museum and I'll fill it. (Picasso) Give me a forum ...
Well, the above is the opposite of modesty.
Besides, I don't know I could afford it even if I converted my whole net worth into it. Or even if I could, getting fuel for it would be a bit tough. I would be looking for fuel all the time, worse than Mad Max had to do.
In a sense, that is my point. With a Great Depression-style 90% haircut, the collateral damage might include a collapse of the “thin veneer of civilization”, so, assuming you could even find fuel, you then have to stay out of harm’s way for an unknown period.
24601NoMore
Thinks s/he gets paid by the post
- Joined
- Dec 8, 2015
- Messages
- 1,166
I ran some backtests on the S&P 500 using VINIX (Vanguard S&P 500 index fund)..interesting results:
- The "underwater" period is (often much) longer than the duration of the bear or downturn. For example, the S&P 500 dropped 44.68% in the 2 year, 1 month bear that started 9/2000 and ended 9/2002. However - and this is the key point..it took 4 years and 1 month, for a TOTAL of 6 years, 2 months from the start of the drop to get back to "even". Backtesting calls this the "underwater period" which is the sum of the duration of the bear market, plus the duration of the time needed to get back to even..
- The 2007-2009 downturn for VINIX was 50.9%. Interestingly, even though it was a higher percentage loss (compared to 9/2000), it came back more quickly - for a total "underwater period" of 4 years, 5 months.
- Combined, the 2000-2002 and 2007-2009 bear markets resulted in stocks essentially returning zero for the period 1/2000 - 12/2010, with some pretty intense drops along the way.
- If you needed to start living off your portfolio at a time (beginning 2001) when the market was valued approximately the same as it is today (per the CAPE 10), things don't look pretty. Let's say you decide on a 3% SWR and start with $1.5M for $45K/yr anticipated withdrawals. For purposes of assessing stock risk, let's also assume it's all in VINIX (unlikely, but for purposes of modeling a high equity % portfolio, a decent thing to compare to). At the end of year 1 (2001), the $1.5M drops to $1,281,429. and your 3% withdrawal is $39,632 (vs the $45K you expected). Year 2, $969,119 with $29,973 SWR. Hits a low of $930,049 in year 8 with a $28,764 withdrawal (still 3%) - and you're short almost $17K of the annual spend needed - higher if you've adjusted the $45K/yr for inflation. Does not recover until mid-way of year THIRTEEN (value now $1,823,289 at end of yr 13 ($56,390 withdrawal). Balance at end of 2018 is $2,350,287 for a CAGR of 3.42% and inflation adjusted CAGR of 1.3%..max drawdown during the period was 53.8 (gulp) percent..
Not unexpectedly, things get a lot better with time. Going back to 1990 (first year data was available for VINIX to backtest), CAGR is 7.03%, or 4.63% inflation adjusted. Sequence of returns is our friend in that example, as the portfolio grows in the first 9 years before hitting the three-year rough spot that begins in 2000. As a result, we never dip south of the initial $1.5M - even with 3% annual withdrawals. Ending balance is also $10.2M, but there were some wild rides along the way - including dipping down 50.9% starting 11/2007 (4 years, 5 months underwater) and down 44.68% starting 9/2000 (6 years, 2 months underwater).
Thought you guys might find that interesting..
The net (to me) is that diversification and LUCK (on avoiding a bad SOR) are key..covering a good portion of your annual expenses via a somewhat predictable income stream (from FI including CDs, bond fund dividends, pensions, SPIAs, etc) is also a HUGE help in being able to lower the percentage of $$ you will need to take out of your portfolio - potentially in a prolonged (6-10 year) "underwater" period. To that point, if one's strategy is to be high (say, 70+% equities) just be prepared for some wild rides along the way and pray that you don't get hit with SORR like at the start of 2000 - which unfortunately has some similarities in market valuations to where we currently are at on CAPE 10..
ETA - I just looked up the CAPE 10 for Jan 1990, an it was apparently 17.03. That's compared to 30.14 currently. Mean is 16.62 and median 15.72, so by all measures, this looks to be a hot and pretty over-valued market at current levels..it COULD of course be that "this time is different", but the likelihood that the next 10 years will be like 2000-2010 appear to much higher than being like 1990-2000, simply based on valuations alone.
Last edited:
NW-Bound
Give me a museum and I'll fill it. (Picasso) Give me a forum ...
- Joined
- Jul 3, 2008
- Messages
- 35,712
The subject of CAPE10 being above the norm has been discussed here often. And this has come up off/on for the last few years.
And that's why many of us try to keep our WR below the usual 4% to have some safety margin.
But abandon stocks altogether? Where to put it all? Bonds, cash, or gold all have risks.
PS. A recent poster said bitcoin was the answer. Yeah, right!")
And that's why many of us try to keep our WR below the usual 4% to have some safety margin.
But abandon stocks altogether? Where to put it all? Bonds, cash, or gold all have risks.
PS. A recent poster said bitcoin was the answer. Yeah, right!
Last edited:
pb4uski
Give me a museum and I'll fill it. (Picasso) Give me a forum ...
... - If you needed to start living off your portfolio at a time (beginning 2001) when the market was valued approximately the same as it is today (per the CAPE 10), things don't look pretty. Let's say you decide on a 3% SWR and start with $1.5M for $45K/yr anticipated withdrawals. For purposes of assessing stock risk, let's also assume it's all in VINIX (unlikely, but for purposes of modeling a high equity % portfolio, a decent thing to compare to). At the end of year 1 (2001), the $1.5M drops to $1,281,429. and your 3% withdrawal is $39,632 (vs the $45K you expected). Year 2, $969,119 with $29,973 SWR. Hits a low of $930,049 in year 8 with a $28,764 withdrawal (still 3%) - and you're short almost $17K of the annual spend needed - higher if you've adjusted the $45K/yr for inflation. Does not recover until mid-way of year THIRTEEN (value now $1,823,289 at end of yr 13 ($56,390 withdrawal). Balance at end of 2018 is $2,350,287 for a CAGR of 3.42% and inflation adjusted CAGR of 1.3%..max drawdown during the period was 53.8 (gulp) percent.. ...
But, very few here would advocate retiring on 100% equities like you use in the run above. Below is a Portfolio Visualizer run with a 60/40 portfolio starting with $1.5 million in Jan 2001 with $45k a year adjusted for inflation. Today you would have $2.6 million nominal and about $1.75 million real and your 2018 withdrawal was $65k. The lowest the portfolio got was $1.23 million.... hardly a cause for panic.
https://www.portfoliovisualizer.com...allocation2_1=40&total1=100&total2=0&total3=0
24601NoMore
Thinks s/he gets paid by the post
- Joined
- Dec 8, 2015
- Messages
- 1,166
But, very few here would advocate retiring on 100% equities like you use in the run above. Below is a Portfolio Visualizer run with a 60/40 portfolio starting with $1.5 million in Jan 2001 with $45k a year adjusted for inflation. Today you would have $2.6 million nominal and about $1.75 million real and your 2018 withdrawal was $65k. The lowest the portfolio got was $1.23 million.... hardly a cause for panic.
https://www.portfoliovisualizer.com...allocation2_1=40&total1=100&total2=0&total3=0
Exactly..but I was attempting to show per OP's original point what someone with a very high allocation (70-80%+ which we tend to see frequently on the forum, even from those in ER) to equities might experience.
60/40 or all the way down to 40/60 or even 30/70 (35/65 per Rick Ferri as the "sweet spot" for those in retirement) is undoubtedly a more appropriate asset allocation for many..it's just that as OP suggested, there are often portfolios mentioned that do not have that much of an allocation to FI to cushion the inevitable volatility inherent in high-equity % portfolios..
Last edited:
pb4uski
Give me a museum and I'll fill it. (Picasso) Give me a forum ...
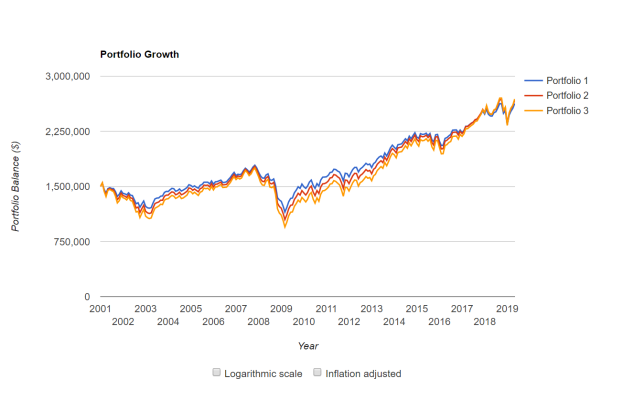
Fair point... same run with 60/40 (blue), 70/30 (red) and 80/20 (yellow).
Lowest balances were in February of 2009... $1.15 million, $1.05 million and $950k, respectively. Scary, for sure, but it was scary back then even if you were in accumulation phase.
https://www.portfoliovisualizer.com...cation2_3=20&total1=100&total2=100&total3=100
Lowest balances were in February of 2009... $1.15 million, $1.05 million and $950k, respectively. Scary, for sure, but it was scary back then even if you were in accumulation phase.
https://www.portfoliovisualizer.com...cation2_3=20&total1=100&total2=100&total3=100
Attachments
marko
Give me a museum and I'll fill it. (Picasso) Give me a forum ...
- Joined
- Mar 16, 2011
- Messages
- 8,426
Interesting.
So, if a member has, say 10,000+ posts and she posts that everyone who holds no equity is a LOSER it carries more weight and you should pay attention?
However, after 10,000+ posts we have an idea as to how credible the posters view might be.
.
Thanks pb4! That was my point. After a while, you get to know who's opinion to trust...by now, for example, everybody here knows never to trust marko when it comes to math!!
Yet I take pb4, ERD50 and audreyh1's financial opinions seriously.
Last edited:
OldShooter
Give me a museum and I'll fill it. (Picasso) Give me a forum ...
Using %s it is not possible to make this conclusion. For example, a $500K portfolio with 40% FI has $200K. As does a $2M portfolio with 10%. In both cases the person has $200K to live on while watching Mr. Market's circus act.... there are often portfolios mentioned that do not have that much of an allocation to FI to cushion the inevitable volatility inherent in high-equity % portfolios..
Similarly a 100% equity position needs no volatility "cushion" if the person's expenses are more than 100% covered by SS, pension, and/or other sources. Yes, the portfolio volatility is higher than for a more conservative AA, but volatility is not risk for this person.
This is kind of a hot button for me; lots of forum posts toss around these % numbers as if they are useful in understanding a person's risk situation. Without $ numbers, they are not.
The other hot button for me is this equation of volatility and risk. They are not the same, except in some specific situations (like SOR problems).
In our case with 75% equities we could go years without having to sell a dime's worth of them. Ergo, very low risk and very comfortable sleep.
Nature Lover
Recycles dryer sheets
.... Would the conversation be different if it was 1954 and the market had still, after 25 years, not recovered its 1929 high?
...After the longest bull market in history, historical gains, and a world economy and market almost completely dependent on Central Bank largesse, I'm wondering if there is not too much optimism on the forum?
JimBob,
Please keep posting. The key questions you ask are reasonable to ask (and as you know from your lurking days, ones that we touch on in many forms several times/year
) As others have mentioned, it's more likely that the way you asked the questions was just more provocative than you expected. As for providing input:
I'm not sure I agree that the economy (and markets) are almost completely dependent on Central Bank largesse. It's helped, of course, but there are plenty of well run, growing, profitable companies. BTW, it would be my opinion that the current political currents, both in the US and abroad, have an equally significant potential impact on our future long-term returns (and there would likely be plenty of opinions on both sides of the debate of whether the impact would be positive or negative over the long-term), as well as many other trends (automation, technological disruption, generational values and their impact on discretionary spending, etc..). IMO there are too many moving parts for any of us to know more than over time there will be both good times and bad. On the other hand, IMO human nature is for people to seek improvement and progress. I like the odds of that producing a growing economy for the markets long-term.
As for excessive optimism, I agree with other posters that there is plenty of "worst case"/financial conservatism represented here as well. Each of us face different circumstances. As for me, I'm still in the 55-60% equities position I was when I retired almost 4 years ago. It's my all-season AA, and I can afford to ride the ups and downs because I have sufficient pension and other non-portfolio income to cover my typical recurring expenses. YMMV.
Best,
NL
marko
Give me a museum and I'll fill it. (Picasso) Give me a forum ...
- Joined
- Mar 16, 2011
- Messages
- 8,426
..it's just that as OP suggested, there are often portfolios mentioned that do not have that much of an allocation to FI to cushion the inevitable volatility inherent in high-equity % portfolios..
Per usual I'm missing something. Can you explain what an 'allocation to FI' means? It is the percent you rely upon for one's Financial Independence? How does that work?
To me most people need the whole portfolio to support themselves to the point of stretching their SWR unless they have good pensions etc.
Or do you mean if you need less than your SWR, you can go into a safer allocation?
I think FI means fixed income in that context.
marko
Give me a museum and I'll fill it. (Picasso) Give me a forum ...
- Joined
- Mar 16, 2011
- Messages
- 8,426
I think FI means fixed income in that context.
Arrrhhh!!!

Thanks. I'm an idiot.
24601NoMore
Thinks s/he gets paid by the post
- Joined
- Dec 8, 2015
- Messages
- 1,166
I think FI means fixed income in that context.
Yep. FI = Fixed Income (Bonds, Bond funds, CDs, SPIAs, etc).
24601NoMore
Thinks s/he gets paid by the post
- Joined
- Dec 8, 2015
- Messages
- 1,166
Using %s it is not possible to make this conclusion. For example, a $500K portfolio with 40% FI has $200K. As does a $2M portfolio with 10%. In both cases the person has $200K to live on while watching Mr. Market's circus act.
Similarly a 100% equity position needs no volatility "cushion" if the person's expenses are more than 100% covered by SS, pension, and/or other sources. Yes, the portfolio volatility is higher than for a more conservative AA, but volatility is not risk for this person.
This is kind of a hot button for me; lots of forum posts toss around these % numbers as if they are useful in understanding a person's risk situation. Without $ numbers, they are not.
The other hot button for me is this equation of volatility and risk. They are not the same, except in some specific situations (like SOR problems).
In our case with 75% equities we could go years without having to sell a dime's worth of them. Ergo, very low risk and very comfortable sleep.
All good and fair points..we're in a similar situation (albeit without pension and pre-SS) and can pay the bills from our FI dividends..that said, I know from previous market meltdowns that my psychological makeup at this point in my life when I'm no longer accumulating but am "de-cumulating" cannot handle watching a hypothetical $1.5M drop to sub $1M or worse. That'd be window jumping time for me personally (OK, maybe not that far, but I know it would stress the bajeebus out of me until values recovered which could be a very long time..), although I realize everyone is different in their ability to tolerate significant swings in their net worth.
So, while I agree with the points made, I'd add that personal ability to stomach big drops in the portfolio is another strong factor..and that gets back to OPs point..while some of us (not me) can indeed tolerate a $1.5M to < $1M drop, I do think that it's generally not always realized that the recovery period is not the "couple of years" that is so often referenced, but as mentioned by several up-thread can be 5, 10 or even in rare cases 20+ years..I think that's the gist - we're frequently told by the financial press and others comforting things like "don't worry - a bear market generally only lasts a couple of years at most". What they DON'T generally tell us is that there have been multiple periods over the past 100 or so years where RECOVERY (ie: back to "even" or better) for the equity portion of our portfolio can be 5, 10, 15 or in cases even 20+ years.
Last edited:
Been reading the forum for some time, but first post. Excellent forum.
The guy could be a financial genius or a complete fool, but with only 5 posts we don't know if we should pay attention or...
Is it just a coincidence that the members you chose (see above) all have numbers in their names?...by now, for example, everybody here knows never to trust marko when it comes to[-] math!! [/-] numbers. (FIFU)
Yet I take pb4, ERD50 and audreyh1's financial opinions seriously.
note: highlighted by the duck
OldShooter
Give me a museum and I'll fill it. (Picasso) Give me a forum ...
... I know from previous market meltdowns that my psychological makeup at this point in my life when I'm no longer accumulating but am "de-cumulating" cannot handle watching a hypothetical $1.5M drop to sub $1M or worse. That'd be window jumping time for me personally (OK, maybe not that far, but I know it would stress the bajeebus out of me until values recovered which could be a very long time..), although I realize everyone is different in their ability to tolerate significant swings in their net worth.
So, while I agree with the points made, I'd add that personal ability to stomach big drops in the portfolio is another strong factor.
Agreed. I thought about including that in the post but it was getting kind of long. In one of my standard rants on using % allocation, particularly brain-dead formulas based on age, I also mention that "demonstrated risk tolerance" is a factor in picking an AA.
In our case we're pretty laid back. We've watched equity gymnastics beginning with the 1987 blip and never worried or sold a dime's worth of stock. Part of that comes from having more than adequate money, but regardless, people's tolerance varies. As they say, life is like school but first you get the test then you get the lesson. That's certainly true for risk tolerance.
I think Fred Schwed said it best: “Art cannot convey to an inexperienced girl what it is to truly like to be a wife and mother. There are certain things that cannot be adequately explained to a virgin by words or pictures. Nor can any description that I might offer here even approximate what it feels like to lose a real chunk of money you used to own”.
Well, a couple of points here. First, many of those charts are based on nominal index values not total return. Dividends do soften the blow. Second, the concept of "even" is kind of silly. Without studying the entrails in detail, I think it is the case that after all big market hits, the recovery starts and continues at some rate. So if a person has to sell equities three or four years after a big hit, during a long recovery, he/she does not sell anywhere near the bottom. Said another way, it is not a financial disaster if one sells before the mythical "even" point.I do think that it's generally not always realized that the recovery period is not the "couple of years" that is so often referenced, but as mentioned by several up-thread can be 5, 10 or even in rare cases 20+ years..I think that's the gist - we're frequently told by the financial press and others comforting things like "don't worry - a bear market generally only lasts a couple of years at most". What they DON'T generally tell us is that there have been multiple periods over the past 100 or so years where RECOVERY (ie: back to "even" or better) for the equity portion of our portfolio can be 5, 10, 15 or in cases even 20+ years.
"Even" is a bit slippery, too. Is it nominal dollars? Nominal index values" Inflation-adjusted dollars? Total return index values? But regardless, it's just a sort of score-keeping number that IMO gets too much focus in discussions like this one. I'm sure the behavioral finance guys have an explanation for this preoccupation.
Last edited:
24601NoMore
Thinks s/he gets paid by the post
- Joined
- Dec 8, 2015
- Messages
- 1,166
"Even" is a bit slippery, too. Is it nominal dollars? Nominal index values" Inflation-adjusted dollars? Total return index values? But regardless, it's just a sort of score-keeping number that IMO gets too much focus in discussions like this one. I'm sure the behavioral finance guys have an explanation for this preoccupation.
I think that's the key point..we're often led (financial press, general beliefs) to think the market gets back to "even" in most cases within a couple / few years. ("Even" of course being the high water mark / peak). The main thing I was trying to emphasize is that's not always the case, and it has taken significantly longer (including one stretch 25+ years) to get there. To me, that was a major point OP was originally making with regard to over-confidence and expectations..
Last edited:
marko
Give me a museum and I'll fill it. (Picasso) Give me a forum ...
- Joined
- Mar 16, 2011
- Messages
- 8,426
Is it just a coincidence that the members you chose (see above) all have numbers in their names?
note: highlighted by the duck
OMG! Awesome catch! I'm sure there's something subconscious going on.
But there was a real reason why my company assigned 2 (two) bean-counters to me just to keep me in line.
In tallying sales numbers, I could take 2+2 and get 9, seven times out of five!!
daylatedollarshort
Give me a museum and I'll fill it. (Picasso) Give me a forum ...
- Joined
- Feb 19, 2013
- Messages
- 9,358
For "fun", go read some of the BH posts from the 2008-2009 meltdown. People were ready to jump out of windows. Many were the same people advocating high equity positions right before they became near suicidal.
Those kind of posts here and on this forum as well definitely influenced our investing approach. That and reading the book Against the Gods:The Remarkable Story of risk and the concept of diminishing marginal utility.
Moemg
Gone but not forgotten
Speaking only for myself, this would stress the bajeebus out of me. I CAN (and would) pay the bills since I'm heavily (70+%) invested in FI..but watching a good part of a lifetime of savings evaporate and not come back anytime soon would probably put me into an early grave..
For "fun", go read some of the BH posts from the 2008-2009 meltdown. People were ready to jump out of windows. Many were the same people advocating high equity positions right before they became near suicidal. It does appear many of us have lived through many decades of investing and have the war scars and battle experience to prove it..but it also does seem (to OP's point) that there may indeed be some degree of over-confidence compared to what we may actually experience in a 50+% down market that does not recover from peak for quite some time..
I retired in january 2008 with 80% equities and I lost almost 40% . I did not jump out my window because I live in an elevated house so the window would be 17 feet up . I did worry but it did not affect my life that much . I took a cut on my income but with a medium pension and ss survivor benefit I was okay .My favorite posts from that time is "Who joined the lost a million club " . It was hysterical . It taught me that you can lose a lot and still survive and laugh about it .
NW-Bound
Give me a museum and I'll fill it. (Picasso) Give me a forum ...
- Joined
- Jul 3, 2008
- Messages
- 35,712
I retired in january 2008 with 80% equities and I lost almost 40% . I did not jump out my window because I live in an elevated house so the window would be 17 feet up ...
I lost 44% in 2003, and 37% in 2009.
Never thought of jumping out any window, not even the ones on the ground floor (which I could just step through).
It's only money.
Last edited:
NW-Bound
Give me a museum and I'll fill it. (Picasso) Give me a forum ...
- Joined
- Jul 3, 2008
- Messages
- 35,712
Fair point... same run with 60/40 (blue), 70/30 (red) and 80/20 (yellow).
Lowest balances were in February of 2009... $1.15 million, $1.05 million and $950k, respectively. Scary, for sure, but it was scary back then even if you were in accumulation phase.
https://www.portfoliovisualizer.com...cation2_3=20&total1=100&total2=100&total3=100
The highest balances of the 3 portfolios were on Oct 2007, and they were higher than the initial $1.5M.
Portfolio 1 (60/40) was at $1.79M at the peak.
At the bottom at $1.15M on Feb 2009, that's a loss of 36% from peak to trough for the 60/40 portfolio.
PS. Hey, in 2007 I was as high as 80% stock, if memory serves. So, my loss of 37% was pretty darn good, because I was selling as the market dropped in 2008.
Tactical AA saved my ass...ets. Heh heh heh...
Last edited:
GravitySucks
Thinks s/he gets paid by the post
At £20,000 or so it's cheaper than a used RV.Well, the above is the opposite of modesty.
Besides, I don't know I could afford it even if I converted my whole net worth into it. Or even if I could, getting fuel for it would be a bit tough. I would be looking for fuel all the time, worse than Mad Max had to do.
So cheap you can't afford to NOT buy one!
https://tanks-alot.co.uk/product/chieftain-tank/
Similar threads
- Replies
- 92
- Views
- 5K
- Replies
- 5
- Views
- 249
- Replies
- 35
- Views
- 2K
- Replies
- 159
- Views
- 8K