Overvalued CAPE10 - does using CAPE8 help?

By the way, it dawned on me about a month or two ago that i am ridiculously overweight in stocks in my taxable portfolio, so in the middle of a switch to much more bonds AND cash (shorter term). I was about 85 percent stocks. Yes, Yikes, but i am still working though close to RE. Now at about 75 percent.. hate doing this and taking the tax bite in my high earnings years, but the downside risk is too great. Will probably get it to 60 percent stocks by year end. Which, yes i know is still about the max for my age and proximity to RE.

Im a huge believer in "whatever makes you sleep well at night" Paying the taxes now, as opposed to curling up in a ball after a crash is much more appealing, than maybe squeezing some more excess unneeded money.
 
That's why jumping completely out of equities based on CAPE10 level doesn't work..
Yup. The standard copilot checklist works pretty well when tempted to market time: Sit down. Shut up. Hang on.

38349-albums210-picture1564.jpg
 
If the SP500 is flat for a year, one still has that 2% dividend yield. Pretty competitive with current bond yields.
 
... I will be paying those travel bills for sure but cannot count on banking the currency related investment gains. :blush:
You can sell just enough to book sufficient gains to pay for the travel bills.

It takes less than 1%, yes? :) So, it is hidden inside the balancing, if you have done it already.

As for me, I think international and EM still have room to run. They trail US stocks for a few years prior to 2017, and the scale has not tilted to the other side yet.

I was kicking myself for holding them instead of listening to Bogle, who said we did not need no stinkin' foreign stocks. This is now time for revenge, and it tastes sweet.

I don't have a huge international equity exposure. I think once I calculated that it was around 25% of my equities, but it certainly is enough to offset expenses creeping up due to exchange rates.

This year UDS/EUR crept up from around 1.15 to above 1.19 while I was in Europe. Last year it was in the 1.05 to 1.07 range which was nice!

I expect international to lag for years in a row before jumping head. Economies are generally out of sync. Thus the benefits of diversification and rebalancing.
 
Last edited:
I was kicking myself for holding them instead of listening to Bogle, who said we did not need no stinkin' foreign stocks. This is now time for revenge, and it tastes sweet.

+1, I was trying to remember why I had them, I could not remember who, what or how I came up with an AA that included International. But I clearly remember Bogle saying don't get them. Wish I heard him first.
 
Does anyone have an idea how much the CAPE10 might be lowered if the corporate tax is reduced to 20%?
 
Not an expert, but wouldn't be surprised if it didn't much at all.

If anything, it would boost returns and push the multiple up a while because many of us think it will increase net earnings.

Most large companies have complicated tax structures, with the US rate just being one factor and usually not even the largest one in overall tax burden.
 
You can sell just enough to book sufficient gains to pay for the travel bills.

It takes less than 1%, yes? :) So, it is hidden inside the balancing, if you have done it already.

As for me, I think international and EM still have room to run. They trail US stocks for a few years prior to 2017, and the scale has not tilted to the other side yet.

I was kicking myself for holding them instead of listening to Bogle, who said we did not need no stinkin' foreign stocks. This is now time for revenge, and it tastes sweet.
Thanks. It just so happens I am about to rebalance back to my target AA and international will get a modest haircut.

I too think that the Europe recovery has room to run. But I am sometimes too optimistic.
 
Does anyone have an idea how much the CAPE10 might be lowered if the corporate tax is reduced to 20%?

Well, I think it already went way up in anticipation of corporate tax cuts. Will it come back down if they are realized? It's hard to say - the equity markets are rarely logical about such thinks and tend to swing between extremes of greed and fear.
 
Thanks. It just so happens I am about to rebalance back to my target AA and international will get a modest haircut.

I too think that the Europe recovery has room to run. But I am sometimes too optimistic.

The nice thing about annual rebalancing, is that if a trend lasts for years, you still get to ride it. I don't mind if I trim the gains from an asset each year over several years. That's just being prudent.
 
The nice thing about annual rebalancing, is that if a trend lasts for years, you still get to ride it. I don't mind if I trim the gains from an asset each year over several years. That's just being prudent.

Right, my trimming is just 1% of assets and leaves me with 60% equities. I have an easier time psychologically changing AA in baby steps.

But now we are well into the business cycle and yes valuations are stretched as discussed here. For our portfolio I wrote down a long time ago what would make me reduce equities:
1. Bonds at decent real returns
2. Equities at high PE levels
3. Our portfolio high versus the inflation adjusted start of retirement value

At present only number 1 is not met. I am contemplating going to 55/45 or even 50/50. And next year I hit age 70, how did that happen?
 
Is there some metric similar to CAPE10 for bonds?

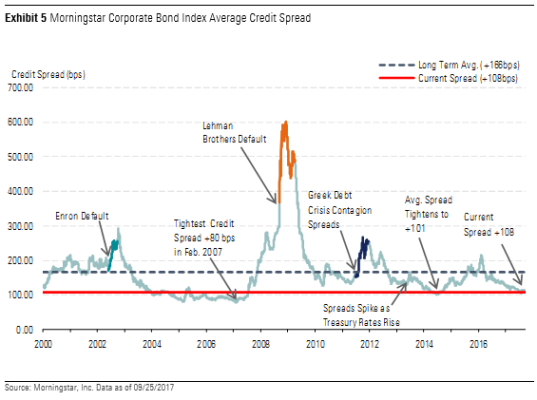
One metric I see used for the valuations of bonds is the spread between asset classes. But this is a relative measure, comparing against the treasuries as the benchmark. It doesn't measure whether treasuries are themselves cheap or expensive compared to, say, inflation.

This shows that the current spread between corporate bonds and treasuries is very very tight, indicating that corporate bonds are overvalued compared to treasuries. From M* http://news.morningstar.com/articlenet/article.aspx?id=826996#cpage=0

And if you want to dig in more you can read this about market valuation, inflation and treasury yields - https://www.advisorperspectives.com...ation-and-treasury-yields-clues-from-the-past
 

Attachments

  • IMG_0334.PNG
    IMG_0334.PNG
    26.4 KB · Views: 23
Last edited:
Since the CAPE is not good at predicting short term returns but is instead a better indicator of longer term forward performance, instead of using it to time the market it seems to make sense to me that it can better be used to determine a SWR baseline. If you are asking "can I retire today with 1 mil in assets providing an income of 40k a year" the answer is different if you are asking in 2001 or in 2003. You can plug your portfolio value into a retirement calculator but that nominal value you enter is mostly baloney, your starting point makes a huge difference. Running the calculator today, I should with some confidence be able to exclude backtesting scenarios that have a start year at the bottom of a trough. CAPE seems like it may help narrow down the 'real' value of the portfolio over time as opposed to nominal. CAPE can't tell you if the market is going to crash this year, but it can tell you that you shouldn't expect a ride up like we had starting in 2009. At the same time, if we have a flash crash of 40% tomorrow, your nominal value would have tanked, but the big long term picture hasn't changed much, the CAPE would have tanked as well and would paint a rosier picture for future long term returns. Your nominal portfolio value has gone way down, but if you haven't sold, the 'real' long-term value of your holdings hasn't changed. Obviously that 'real' value is impossible to actually put a number on but I think the CAPE is the best tool I've heard of to try and create some idea of it.

MadFientist had the same idea and created a calculator to suggest a SWR based on current CAPE which you need to sign up to see. I don't know what the equation he's using is, would be curious. I was playing around with some numbers once and came up with an equation of SWR = 11.705*CAPE^-0.383 but for the love of god don't believe my numbers, I have no idea what I'm doing. (I was using Shiller data from 1891 on, as opposed to just the last 50 or 30 years of whatever you might be inclined to use as the new CAPE baseline/average) In doing so I was charting various safe withdrawal rates compared to various CAPE ratios and ending portfolio balances from backtesting scenarios. It's really remarkable how clear a correlation there is between the CAPE and portfolio performance over time. It's no wonder the guy won a prize for it.
 
Last edited:
MadFientist had the same idea and created a calculator to suggest a SWR based on current CAPE which you need to sign up to see. I don't know what the equation he's using is, would be curious. I was playing around with some numbers once and came up with an equation of SWR = 11.705*CAPE^-0.383 but for the love of god don't believe my numbers, I have no idea what I'm doing. (I was using Shiller data from 1891 on, as opposed to just the last 50 or 30 years of whatever you might be inclined to use as the new CAPE baseline/average) In doing so I was charting various safe withdrawal rates compared to various CAPE ratios and ending portfolio balances from backtesting scenarios. It's really remarkable how clear a correlation there is between the CAPE and portfolio performance over time. It's no wonder the guy won a prize for it.
Well that's funny, because the SWR CAPE indicator has 3.5 as the lower limit, and using an 8/1/17 CAPE10 of 30.3, it appears to be pegged below that number. So you can't see what the number actually is, but probably below 3.5, but since they use a graphic instead of a number, you can't tell!

When the article was published in 2015, CAPE10 was 24 and SWR was around 4.
 
Last edited:
I think adjusting portfolio allocation somewhat based on CAPE10 around a nominal AA is a long term bet. As in "my portfolio should be better off in 10-15 years"
 
Yes, those worst case stock market sequences become more relevant as we move toward higher market valuations. Just what probability to assign to a really bad sequence (like the one starting in 1966) is not clear but it is more probable than it was in 2009.

On further reflection, I have already based our spending on worst case information, so the current market shouldn’t affect our planning.
 
Last edited:
Over on bogleheads, there was a discussion a while back. This was on the main VPW withdrawal method thread. In short, VPW uses the PMT function in Excel to set the annual withdrawals. It's akin to the principle paid on a loan where the amount withdrawn as a percentage of your portfolio monotonically increases to 100% for the last year planned. Anyway, since VPW withdraws a percentage of the remaining portfolio, the actual dollar amount (whether nominal or real) can fluctuate a lot year on year based on the portfolio's returns (or lack thereof).


VPW, in its pure form, uses an expected return to set the rate used in the calculation based on long term historical returns. Late in the thread, it was proposed to reset the rate in the PMT calculation each year based on CAPE to act as a smoothing function. Likewise, for the bond portion one can estimate future returns based on current rates. So you ultimately calculate an estimated long term return based on CAPE for the stock portion and the current bond rates for the bond portion. I've played around with it and it can definitely provide some long term smoothing.


The main difference between VPW and SWR is that with VPW your portfolio will last exactly as long as you originally planned for it to last when you set it up. The tradeoff is that in order for that to be accomplished, your withdrawals are not guaranteed to keep up with inflation and they will fluctuate. And if you choose a fixed, initial rate that is too high, while you will not run out of money, the calculated withdrawals may fall below your expenses. That's why the author who proposed it (Longinvest) advises uses it on top of a fixed base of income (Pension, SS, Annuity).


Cheers,
Big-Papa
 
My "solution" to the conundrum of relatively rich stock valuations was to rebalance stock allocations to the bottom of my range (low of 58%; high of 66%), early this year and I'm about to do it again.
I am letting international stocks run, since I think they are relatively (emphasize relatively) undervalued in the recovery; EM and foreign and particularly foreign small cap/value have been on a tear that almost makes up for the last 3 years of underperformance.
And Audrey is right; government intermediate/long term bonds did quite well in the 2008 massacre. I'm reluctantly putting some stock gains in those, even though I hate them, since in a stock bear they will do well. If inflation picks up and global growth picks up speed, they won't do well, at least short term, but I'm willing to take the bullet.
And yes there are good reasons, including low interest rates and tax cuts/deficits and apparent global growth, for stocks to continue higher for longer than Cape 10 or 8 would suggest. I'm willing happily to continue to scalp almost half of gains into cash and bonds.
 
Last edited:
Back
Top Bottom