Overvalued CAPE10 - does using CAPE8 help?

audreyh1

Give me a museum and I'll fill it. (Picasso) Give me a forum ...
Joined
Jan 18, 2006
Messages
38,165
Location
Rio Grande Valley
Current CAPE10 according to Shiller PE Ratio is 30.62 - an extreme level by historical standards.

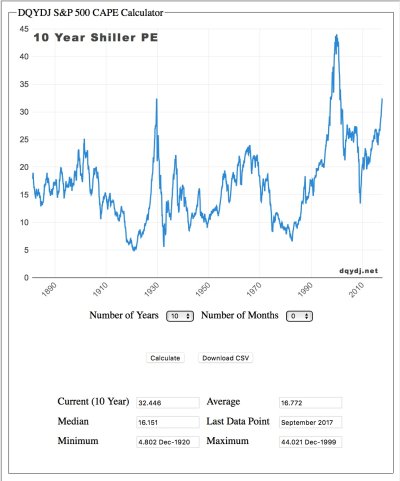
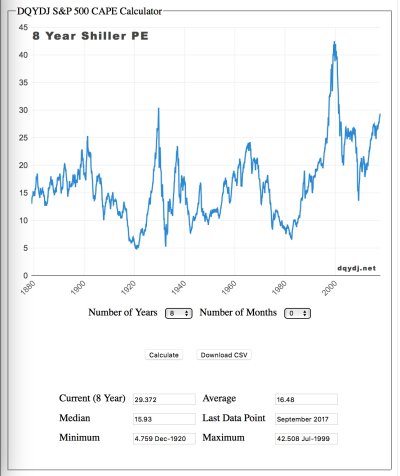
There have been a few discussions about the CAPE metric and whether removing the 2008-2009 years will help. This will happen naturally in a couple of years - but how much will it really help? One way to do this is to do an average over 8 years rather than 10 which removes the uber low earning years of 2008 and 2009. I have attached a comparison below of the curves for CAPE10 and CAPE8 from https://dqydj.com/shiller-pe-cape-ratio-calculator/ *

It has the general result of shifting the curve and the median down slightly. But it does not miraculously “fix” the ramp up into nosebleed territory since late 2016, and it still indicates that numbers above 26 are very rich indeed.

Another issue that is brought up is how accounting rules (GAAP) have changed, particularly This argument is mainly to point out that the long-term average is probably no longer relevant. I have read a few articles that indicate you would need to subtract a few points - say 2 or 3 - post 2001, to accommodate this change. With current values so high, subtracting 3 points means you are still really high.

Kitces wrote an article a back in 2012 reviewing some of the various arguments about CAPE10 and changes in accounting over the decades and concluded that:

To which all I can reply is… who cares!? Even with the author’s own adjustments, the CAPE is screaming that the market is overvalued. Perhaps after*the market falls 35%, where the author’s CAPE suggests the market is “fair value” and Shiller’s P/E10-based CAPE suggests the market is still 7.6% overvalued, we can debate whether the market really has to fall another 7% (after the first 35%), or if it’s done. Either way, both methodologies “predict” at least a nearly 35% overvaluation, implying severely substandard returns in the coming years! ........... Are we really going to debate the last 7% of a 42% market decline? Are we completing missing a raging forest fire by focusing on the health of the individual trees?
https://www.kitces.com/blog/adjusting-portfolios-based-on-valuation-are-we-expecting-too-much/

Personally, I don’t try to determine what the “long term average” of CAPE10 should be, and use that as the gage. I don’t completely believe in the revert to mean philosophy for periods long ago. I tend to look at the last three decades of the curve and compare relative values. Eyeballing it I have picked >=25 as the "overvalued" level and <=18 as the "OK to invest more aggressively", making 21.5 the center of that band. CAPE10 has been above 21 during most of the past three decades.

* there is a 2 point discrepancy between what dqydj.com lists as current CAPE10 and what the multipl.com site gives. Can't answer that one.
 

Attachments

  • CAPE10.jpg
    CAPE10.jpg
    187.1 KB · Views: 89
  • CAPE8.jpg
    CAPE8.jpg
    184.9 KB · Views: 89
Wow, this is awesome, In 2 lifetimes I couldn't crunch the numbers like you did, thank you. I had this very question in another thread.
 
Wow, this is awesome, In 2 lifetimes I couldn't crunch the numbers like you did, thank you. I had this very question in another thread.
I remember your question so dug up some web research I had done earlier this year. I did not crunch these numbers - the "Don't Quit Your Day Job" dqydj website provides the calculator.
 
Thank you, I was looking for some sort of cape 8, i just couldn't find it. I even did a cape 6 in the calculator you provided. The linked article said a business cycle is 6 so I did that. Seems after all is said and done its near the high end still. I missed 3 points for the new GAAP figures. Maybe Ill subtract 10, then everything will look like a bargain:D
 
I did the work because I have been considering a slight AA shift based on CAPE10.

60/40 for CAPE10 <= 18
50/50 for CAPE10 >= 25

and ramping between the two. So is my "normal" 55/45 for CAPE10 = 21.5

This is a small shift, but it might help me stay invested when markets seem extremely valued and get a wee bit more aggressive when markets have been soundly walloped.
 
Mr. Shiller just published an essay at Project Syndicate (here) titled "The Coming Bear Market". He discusses the current valuation and past bear markets. Typically, he makes no projections, but does conclude with this:
In short, the US stock market today looks a lot like it did at the peaks before most of the country’s 13 previous bear markets. This is not to say that a bear market is guaranteed: such episodes are difficult to anticipate, and the next one may still be a long way off. And even if a bear market does arrive, for anyone who does not buy at the market’s peak and sell at the trough, losses tend to be less than 20%.

But my analysis should serve as a warning against complacency. Investors who allow faulty impressions of history to lead them to assume too much stock-market risk today may be inviting considerable losses.
 
Isn't the market up more than 20% since the last time we had this discussion? I know it is up some 14% just this year alone.
 
Ugh, I was hoping the article was written 1 year ago so I can say haha, the market is up already 20 % so a bear market would be a loss of zero.

Much to my chagrin, it was written 2 days ago. yikes. Hopefully in 364 more days I can reference this article and say haha, and not boo who,
 
This one was recent but I swear I remember us discussing this last year and the year before that and the market being overvalued then too. I will dig around.
 
This one was recent but I swear I remember us discussing this last year and the year before that and the market being overvalued then too. I will dig around.

It's been overvalued for quite a whil, but it keeps getting more overvalued. We know from the late 90s and mid 2000s that the situation can persist for a long time.
 
Ok, here is a thread we discussed on here in 2013

http://www.early-retirement.org/forums/f28/welcome-to-the-4-return-market-69326.html

"Robert Shiller says his calculations suggest stocks will rise about 2.5% a year for the next decade, plus inflation, which has recently been averaging 1.5%."

Ok so the S&P has returned just about 40% since this thread.

Hmm.

edit: Mistake, it is actually 50% if you reinvest dividends.
 
Shiller sounded his alarm too early, but the fact is that the stock market cannot keep on rising 12% a year. Equity prices are determined by revenues of companies, and how do they sell 12% more each year? Who are the buyers of these goods?

Just last week, I saw an article in Bloomberg discussing a paper putting out by Vanguard. The gist is that the stock market increase in 2017 so far was unexpected, and Vanguard investors should not expect the same increase to continue.

And so, all one can hope for is that the P/E will not revert as Shiller warned, and if it stays the same, we will have a low single-digit annual stock gain as Bogle keeps talking about.

Yep, I will keep on writing covered calls to get an extra 1%/year as I have been doing.
 
Ok, here is a thread we discussed on here in 2013

http://www.early-retirement.org/forums/f28/welcome-to-the-4-return-market-69326.html

"Robert Shiller says his calculations suggest stocks will rise about 2.5% a year for the next decade, plus inflation, which has recently been averaging 1.5%."

Ok so the S&P has returned just about 40% since this thread.

Hmm.

edit: Mistake, it is actually 50% if you reinvest dividends.
That's why jumping completely out of equities based on CAPE10 level doesn't work..
 
Automation, world markets expanding (third world wanting first world stuff), AI. So many things going on that really might make this "different than last time"
 
CAPE10 is not a tool for timing the market, it is a methodology for estimating future returns.
 
I am sure that companies in developed world can step up their production to sell 12% more each year easily. Yes, much of the rest of the world does not have much, and can buy more. The problem is that they ain't got money to pay for all these goods.
 
Last edited:
I did the work because I have been considering a slight AA shift based on CAPE10.

60/40 for CAPE10 <= 18
50/50 for CAPE10 >= 25

and ramping between the two. So is my "normal" 55/45 for CAPE10 = 21.5

This is a small shift, but it might help me stay invested when markets seem extremely valued and get a wee bit more aggressive when markets have been soundly walloped.
According to the signal, we are on borrowed time. I also watch PE10 in my monthly numbers.

COB Monday I'll be re-balancing again (have been a few this year). Our equity target is 53% overall, and we're at 54%.
 
I did the work because I have been considering a slight AA shift based on CAPE10.

60/40 for CAPE10 <= 18
50/50 for CAPE10 >= 25

and ramping between the two. So is my "normal" 55/45 for CAPE10 = 21.5

This is a small shift, but it might help me stay invested when markets seem extremely valued and get a wee bit more aggressive when markets have been soundly walloped.
This kind of modest adjustment based on CAPE10 is very attractive to me, and the historic data shows it works very well at improving risk-adjusted returns. I couldn't stomach using CAPE10 and being entirely out of stocks for a decade (of great returns), but just adjusting to the bottom end of my equity range seems very logical and palatable. You have to be patient and be willing to be "wrong" for a decade or so. One of the attractive things about this type of[-] market timing[/-] tactical asset allocation is that the CAPE10 is such an imprecise signal/trigger that it is virtually worthless to money managers at funds, etc. They can't afford to be wrong for a decade, so they have to use something else.
Another thing: IIRC, when the CAPE10 shows that stocks are extremely overvalued, the fall tends to be fairly severe, and in those conditions, government bonds have proven to be more effective diversifiers than corporate bonds (when the world looks like it is coming part, there is a flight to quality and the govt bonds get bid up). So, another refinement might be to increase the % of govt bonds within the bond allocation when stocks are high.

Kitces and Pfau have published some good papers on this, I think we linked to them on earlier threads.
Edited to add: here's one long thread, there are others: Using Shiller PE to Time the Market
 
Last edited:
I agree - government bonds are better at cushioning through big market drops even though they tend to lag other bond classes during the good times. For this reason I make sure a good chunk of my bond allocation is in high quality bonds. As I increase my bond allocation under high CAPE10 - put it in high quality? Sounds like a good idea.

Good observation that extreme highs in the CAPE10 seem to indicate market selloffs will be more severe. Hadn't thought about that.....
 
From a Consuelo Mack interview with risk expert Peter Bernstein
Equities are still valued at historically high prices. Interest rates, I don't have to tell you, are historically low. And so you start from there, and there you are. I think something very important to think about this, that a period of low returns, you think, well, every year maybe we'll have 4%, 5%. It doesn't work that way. Low returns result from high volatility. You have a big year, and then a bad year, and the pattern of low return periods is high volatility, not low volatility. It's a scary time
 
What are you supposed to do with that info? We had Shiller predicting a decade of 4% returns (including inflation) and four years into that we are sitting at 40% or higher returns.
 
If you change from 60/40 to 50/50 and say equities fall 50% and treasuries rise 10% (Vanguard intermediate treasury fund returned 13.32% in 2008)

A 60/40 portfolio is has lost 26% of its value and a 50/50 portfolio has lost 20% of its value. That's a pretty big deal! The 60/40 portfolio loses 30% more!

I've been hesitating due to cap gains taxes, but I'm going to think about this some more. I could do half this year and half next.

On the other hand, if the market goes up 40% and treasuries stay flat....
a 60/40 portfolio goes up 24% and a 50/50 portfolio goes up 20%.... ie. that 60/40 goes up 20% more than the 50/50. But since I'm already living comfortably on less than my 4% of portfolio, this doesn't cause a lot of excitement.
 
Last edited:
Can treasuries actually rise 10% from these levels? In 2008 bonds were paying significantly more than they are now.

What if the market drops 50% and bonds drop 20%? Has something like that ever happened?
 
Back
Top Bottom