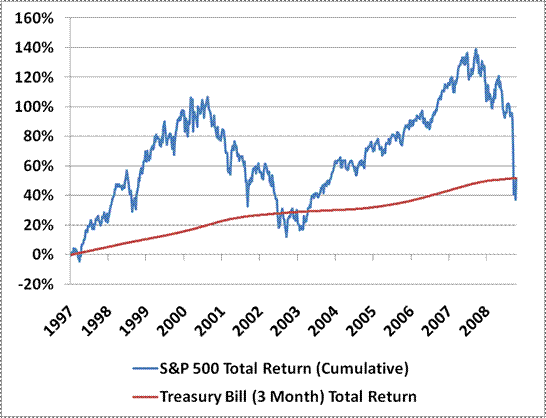
Hussman's intent was to demonstrate that returns over a complete cycle are contingent on entry valuations. Ha
Yes!
Additionally, I would like to offer some observations as follows.
1) What I see from the graph is that a person who bought and held the S&P index for 10 years ended up at the same point as if she held Treasuries through the same period. And the latter would not be so emotionally draining.
2) An accumulator who has been DCA'ing during this cycle into S&P 500 would end up losing money, compared to one who has been accumulating treasuries. I don't know how one would fare if he also accumulated into bonds during the same time.
3) One who auspiciously picked a sector that performed better than S&P 500, AND also was able to fight greed so as to get out at the top of the cycle would do very well. In the bull cycle topping out in 2000, it was the tech sector. In the more recent cycle, it was the energy and the material sectors. What is the next hot sector? I don't think any can tell, as we might not have stopped digging yet. Of course this is tough, as Malkiel and Bogle have told us that no one could do this consistently.
4) However, we could also see that if one practiced "balancing" religiously, one could beat treasuries by selling when stocks became highly valued at the top of the economic cycles. It is not possible to time the top and bottom perfectly, but it should be possible to obtain an advantage of a few percent over treasuries. If we remembered that things tend to revert to the mean and if we take the mean as treasuries, then we would sell when equities have substantially outperformed treasuries. Sadly, we tended to think that good times roll on forever, hence might not rebalance to cash in 2007. Could we have sold some stocks in 2007, not knowing about the impending credit crunch, and just from looking at this graph?
5) Looking at the graph, I can see that
if the economic cycle
repeats itself - at least in the near future - then this present time appears to be the period of undervaluation of equities. It would mean that this is a good entry point for stock buyers. Of course, if you are a "gloom and doomer", then this graph does not mean anything to you about the predictability of the future.
It seems Ha believes in the recurrence of the cycle, hence he recently went to the 100% equity position. The recent financial fiasco, and to some people the election outcome, might have caused some to think that an upswing is unlikely, at least in the foreseeable future. As I am prudently optimistic, I do not think the situation is hopeless, but do not want to place all my bets yet.
Hence I am slowly getting back into the market from a position of 70% cash. Very slowly.
By the way, I am not fond of either presidential candidate, so the election outcome did not concern me much. The fact that both legislative and executive branches get controlled by one party bothers me more. Still, that does not cause me to abandon hope. Not yet anyway. And then, there are always foreign markets to consider.