SWR failures from history

I’ll point out that AWSHX on the back test model using a starting point of 1985 and a starting balance of $1million and a 7% annual withdrawal had an ending balance thru last month of $3.3million for a CAGR of 3.3% after withdrawal. I am not a fan of this mutual fund due to expenses but it is a true real life test that survived through the 1987, 2000,2008,2020 meltdowns. It’s an old fund so the Calculations are not hypothetical.

Sounds very impressive, but how would a person have known that in 1985?

If that was your holding over all these years, congratulations! You picked a good one.

I wonder what a 100% investment in the S&P500 or total us market index in 1985 would have ended up with using the same withdrawal.
 
Last edited:
I’ll point out that AWSHX on the back test model using a starting point of 1985 and a starting balance of $1million and a 7% annual withdrawal had an ending balance thru last month of $3.3million for a CAGR of 3.3% after withdrawal. I am not a fan of this mutual fund due to expenses but it is a true real life test that survived through the 1987, 2000,2008,2020 meltdowns. It’s an old fund so the Calculations are not hypothetical.

I am puzzled by this because I see AWSHX is up less than 500% since 1985 while S&P 500 is up more than 1500%. (Not reinvested dividends)

Unless AWSHX pays huge dividend.
 
Last edited:
I’ll point out that AWSHX on the back test model using a starting point of 1985 and a starting balance of $1million and a 7% annual withdrawal had an ending balance thru last month of $3.3million for a CAGR of 3.3% after withdrawal. I am not a fan of this mutual fund due to expenses but it is a true real life test that survived through the 1987, 2000,2008,2020 meltdowns. It’s an old fund so the Calculations are not hypothetical.


That is really impressive
looks like oldest S and P 500 ETF is SPY and that was created in 1993
$1,000,000 invested with 7% withdrawal rate has a balance today inflation adjusted $928,000
 
Last edited:
That is really impressive
looks like oldest S and P 500 ETF is SPY and that was created in 1993
$1,000,000 invested with 7% withdrawal rate has a balance today inflation adjusted $928,000

There are older funds. VFINX, Vanguard 500 Index Investor, has data back to 1985 here:

https://bit.ly/2OWNyRv <<< short-link to portfoliovisualizer.com/backtest-portfolio

AWSHX and VFINX are essentially the same performance. This includes dividends in both.

-ERD50
 
There are older funds. VFINX, Vanguard 500 Index Investor, has data back to 1985 here:

https://bit.ly/2OWNyRv <<< short-link to portfoliovisualizer.com/backtest-portfolio

AWSHX and VFINX are essentially the same performance. This includes dividends in both.

-ERD50

Oh wow okay. When I googled “ oldest s and p etf” spy came up.
That’s really amazing that a 7% WR still yielded such a high ending balance.
 
Oh wow okay. When I googled “ oldest s and p etf” spy came up.
That’s really amazing that a 7% WR still yielded such a high ending balance.

IIRC, if you take out the top 6 or so worst years to start retirement, the average WR that works would be ~ 6.5%.
 
I’ll point out that AWSHX on the back test model using a starting point of 1985 and a starting balance of $1million and a 7% annual withdrawal had an ending balance thru last month of $3.3million for a CAGR of 3.3% after withdrawal. I am not a fan of this mutual fund due to expenses but it is a true real life test that survived through the 1987, 2000,2008,2020 meltdowns. It’s an old fund so the Calculations are not hypothetical.

The P/E 10 of the S&P 500 was about 10 in in the beginning of 1985, now it is a bit under 30. In that time frame, you had the normal gain in earnings plus a 3 x run up in valuation. If that were to be repeated today, the P/E 10 of the S&P 500 would be close to 90 in 2050, rivaling the Japanese market at its peak. That would be great for us, but I wouldn’t count on it.
 
The P/E 10 of the S&P 500 was about 10 in in the beginning of 1985, now it is a bit under 30. In that time frame, you had the normal gain in earnings plus a 3 x run up in valuation. If that were to be repeated today, the P/E 10 of the S&P 500 would be close to 90 in 2050, rivaling the Japanese market at its peak. That would be great for us, but I wouldn’t count on it.

My sense is it is not a simple as “ oh the PE was low so ......”

end of 2008 the PE was something like 50. If things were only that simple!
 
Sounds very impressive, but how would a person have known that in 1985?

If that was your holding over all these years, congratulations! You picked a good one.

I wonder what a 100% investment in the S&P500 or total us market index in 1985 would have ended up with using the same withdrawal.


Nobody would have know that. Moreover, nobody would have been as diversified either. Most likely most people would have held Kodak, GE,GM,F and a lot of other loser large ‘safe’ companies. It makes one wonder how accurate data really is on Firecalc
 
My sense is it is not a simple as “ oh the PE was low so ......”

end of 2008 the PE was something like 50. If things were only that simple!

And what would that something else be? Certainly there are other forces that determine future stock prices, but for a long term 30 year retirement, the starting P/E10 has been a strong predictor of SWRs (see graph in post 24).
 
Again, I feel the need to point out that "withdrawing 7% of the portfolio" is not the same as "withdrawing 7% of the initial portfolio, then adjusting that withdrawal for inflation in the future."

In the example given, they both would have worked, but neither would have worked, obviously, in less propitious times.
 
My sense is it is not a simple as “ oh the PE was low so ......”

end of 2008 the PE was something like 50. If things were only that simple!
Big difference between P/E and P/E10 a.k.a CAPE10 which is used in the studies cited.
 
There are older funds. VFINX, Vanguard 500 Index Investor, has data back to 1985 here:

https://bit.ly/2OWNyRv <<< short-link to portfoliovisualizer.com/backtest-portfolio

AWSHX and VFINX are essentially the same performance. This includes dividends in both.

-ERD50

Nice Tool!
Almost nothing beats simple VTI or S&P 500 Index.
 
Last edited:
And what would that something else be? Certainly there are other forces that determine future stock prices, but for a long term 30 year retirement, the starting P/E10 has been a strong predictor of SWRs (see graph in post 24).


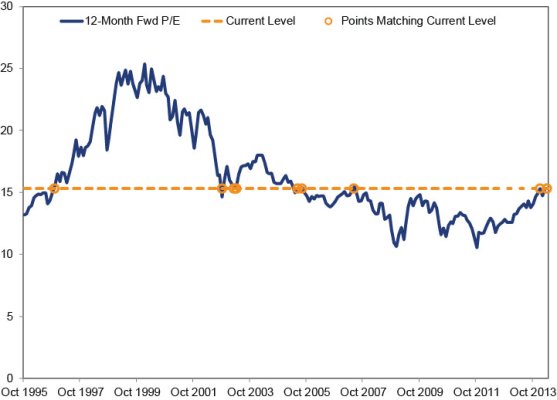
couple things...S and P earnings for 2019 were 160 so with the S and P at 3200 the PE is 20 not 30....But most importantly P/Es—no matter how you slice, dice and splice the data—are of little use in forecasting market conditions. This chart --although dated--illustrates this:
 

Attachments

  • PEexhibit10.jpg
    PEexhibit10.jpg
    41.5 KB · Views: 38
Last edited:
Big difference between P/E and P/E10 a.k.a CAPE10 which is used in the studies cited.


But still... Yes, the CAPE is the highest it has been since 2007, 2000 and 1929, when major bear markets began. But coincidence doesn't make the CAPE a valid timing tool or predictive in any way, shape or form. Conceptually, the CAPE has problems. Its denominator is the 10-year average of bizarrely inflation-adjustedhttps://www.fisherinvestments.com/en-us/marketminder/cape-nothing-to-fear#_edn2 earnings. That is supposed to adjust for economic cycles, but it doesn't tell you anything about stocks' future earnings streams, which is what you're buying.
 
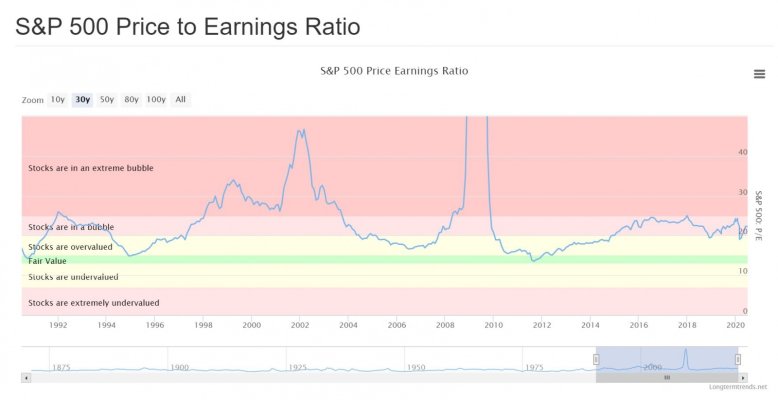
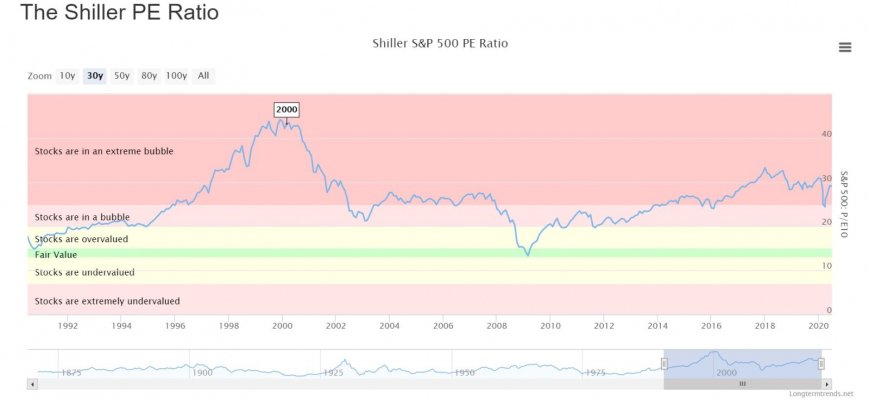
I found this interesting:
 

Attachments

  • Capture.jpg
    Capture.jpg
    181.4 KB · Views: 65
  • Capture2.jpg
    Capture2.jpg
    166.6 KB · Views: 58
Oh wow okay. When I googled “ oldest s and p etf” spy came up.

That’s really amazing that a 7% WR still yielded such a high ending balance.


Yes start in 1986 with $1million start and $70k annual withdrawal with inflation adjustment ends with over $8million YTD ending balance
 
I found this interesting:


Yep. There is no direct correlation. As I said earlier, if it were only that easy!
Nor is there one magic P/E level that signals a peaking bull. Multiples got to 25 as the Tech bubble peaked in 2000, while other peaks featured lower P/Es. Levels aren't really telling. It's more a question of whether P/Es suddenly accelerate and spike.
 
Yes start in 1986 with $1million start and $70k annual withdrawal with inflation adjustment ends with over $8million YTD ending balance

I think that a starting retirement in 1982 has yielded the best results apples to apples.
 
I think that a starting retirement in 1982 has yielded the best results apples to apples.


It appears retiring in a recession is best as you delay the risk of another downturn for at least 5 years according to history.
 
It appears retiring in a recession is best as you delay the risk of another downturn for at least 5 years according to history.


in theory yes, but unfortunately the stock market doesn't move in lock step with the economy.
 
in theory yes, but unfortunately the stock market doesn't move in lock step with the economy.

It appears retiring in a recession is best as you delay the risk of another downturn for at least 5 years according to history.

Palmer - generally agree. It is early still, but retiring in 2009 is also off to a great start as another example.

Free866 - yes this can also be true.
 
couple things...S and P earnings for 2019 were 160 so with the S and P at 3200 the PE is 20 not 30....But most importantly P/Es—no matter how you slice, dice and splice the data—are of little use in forecasting market conditions. This chart --although dated--illustrates this:

I am using P/E10, not P/E (which tends to be lower). The P/E10 uses real per share earnings over 10 years and is less volatile than the P/E. According to multipl.com, it is 29.97 today and for most of 2019 was over 30.

I think you may misunderstand my point. Your chart shows that the market tends to return to an average valuation. This is a long term empirical trend and is consistent with the data shown in my graph. If one retires when the market is priced high, they are likely to have a lower SWR than if they retire when the market is priced low. One can plot SWRs vs starting P/E10 For every year between 1928 and 1990 for a 30 year retirement. The data show a clear relationship. Yes there is some noise in the data, but the curve shows a definite relation between the two.
 
It appears retiring in a recession is best as you delay the risk of another downturn for at least 5 years according to history.

Yes, but unfortunately one’s portfolio is usually down during a recession. If you could figure out how to keep your pre-recession portfolio intact and then retire at the bottom of a recession, that would be ideal.
 
Back
Top Bottom