Midpack
Give me a museum and I'll fill it. (Picasso) Give me a forum ...
IMO, SWR calculators/methodology is as good a method as any to help establish "how much do I need?" during the accumulation phase (still working), it figured heavily into my pre-retirement planning.
But once retired and grappling with the various sources of income (taxable accts, tax deferred, pensions, annuities, Soc Sec, inheritance, etc.) and which to withdraw when to minimize tax impact, SWR is no longer of much if any use.
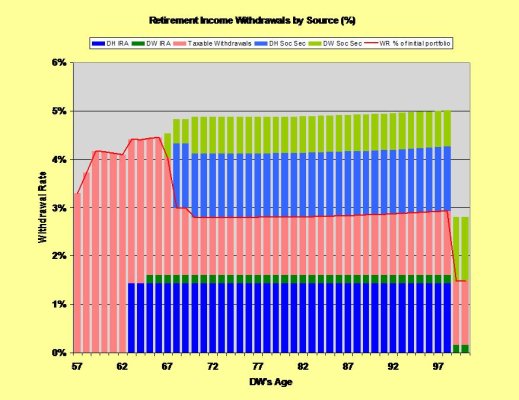
I'm a picture is worth a thousand words type, so below are the theoretical optimal withdrawals by source in our future in the first (bar) graph. [I am currently revisiting (starting) Roth IRA conversions, which will add another income source to optimize.]
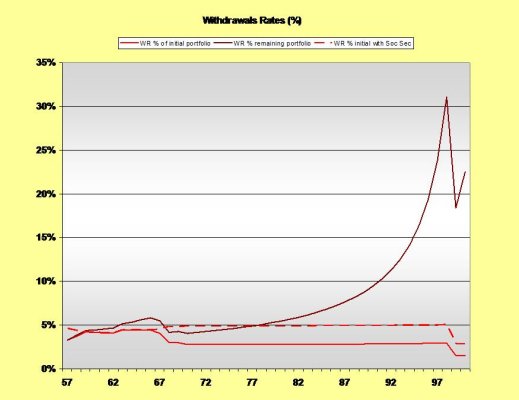
The second (line) graph is a repeat of a drum I have beaten here before. While the % of initial portfolio (with and without Soc Sec, the former is far less meaningful IMO) numbers seem very "reasonable." But when you look at what the corresponding "% of remaining portolio" withdrawals that go with following an SWR or constant dollar approach actually are, the percentages increase pretty dramatically in later years. Note the % of remaining portfolio withdrawals in age 80's and 90's, I'd guess most won't have the stomach to stay the SWR course come what may. Imagine withdrawing 30% of your remaining funds at age 97! Though, no one is supposed to blindly follow SWR methodology anyway, and accredited authors have said as much every time they're published. The path through retirement distribution isn't anything like these graphs, non linear to be sure.
For your amusement.
I only wish there were much better retirement income calculators out there to help grapple with all the moving parts...
My purpose is not to debate my many assumptions or actual plans (they're more conservative), this post is only meant to illustrate the subject.
But once retired and grappling with the various sources of income (taxable accts, tax deferred, pensions, annuities, Soc Sec, inheritance, etc.) and which to withdraw when to minimize tax impact, SWR is no longer of much if any use.
I'm a picture is worth a thousand words type, so below are the theoretical optimal withdrawals by source in our future in the first (bar) graph. [I am currently revisiting (starting) Roth IRA conversions, which will add another income source to optimize.]
The second (line) graph is a repeat of a drum I have beaten here before. While the % of initial portfolio (with and without Soc Sec, the former is far less meaningful IMO) numbers seem very "reasonable." But when you look at what the corresponding "% of remaining portolio" withdrawals that go with following an SWR or constant dollar approach actually are, the percentages increase pretty dramatically in later years. Note the % of remaining portfolio withdrawals in age 80's and 90's, I'd guess most won't have the stomach to stay the SWR course come what may. Imagine withdrawing 30% of your remaining funds at age 97! Though, no one is supposed to blindly follow SWR methodology anyway, and accredited authors have said as much every time they're published. The path through retirement distribution isn't anything like these graphs, non linear to be sure.
For your amusement.
I only wish there were much better retirement income calculators out there to help grapple with all the moving parts...
My purpose is not to debate my many assumptions or actual plans (they're more conservative), this post is only meant to illustrate the subject.
Attachments
Last edited:
")