Hey guys, the
Bill, Betty and Bob Firecalc example is extremely
misleading. It overstates the difference that one or two years can make.
Here's my reasoning, tell me if you think I've got this about right.
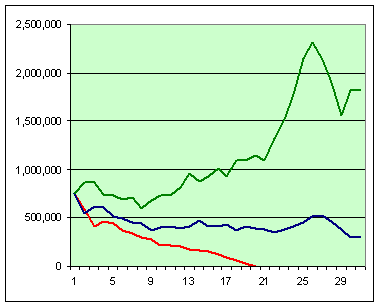
It says "Each had $750,000 in their nest egg." That makes you think that they started in the same place. But in fact, in 1973 Bob had much more money than Bill. That's because he had $750,000 after two years of a bear market. Based on the graph, Bob had about $1,400,000 in 1973. If Bill had retired in 1973, he would have done just about as well as he did retiring in 1975. The only difference is that he wouldn't have contributed to his retirement accounts in 73 and 74 -- those contributions would have been relatively insignificant compared to his 1.4 Million.
If you're not convinced, imagine that the example were stated like this: In 1973 Bill had $1.4 million and Bob had 750K. Bill retired and ran out of money. Bill waited two years to retire and didn't run out of money.
So take heart guys, a year or two doesn't make as much difference as you might think. The reason is that your contributions are small relative to your current nest egg.
")


 You just to laugh it off and go on enjoying life, as challenging as that can be with all this crap going on.......