Understanding standard deviation and returns

jIMOh

Thinks s/he gets paid by the post
Joined
Apr 3, 2007
Messages
2,223
Location
west bloomfield MI
I see a portfolio of 55% stocks and 45% bonds gives an average return of 8.5% with a standard deviation of 9.9%.

I am trying to "interpret" standard deviation and set expectations.

Does this mean most returns are between -1.4% and 18.4%? (8.5-9.9 and 8.5+9.9)? I don't think so... but asking to be sure.

Does this mean most returns are between [8.5- (9.9%*8.5)] and [8.5+(9.9%*8.5)] which means most returns are between 7.65% and 9.34%?

Then how often is someone getting "most returns"- is that 66% of the time, 75% of the time or whatever range on the bell curve?

Its been 15 years since I took statistics, any help is appreciated. Thx
 
Should be about
68% chance returns are +/- 1 SD (your first case -1.4% to 18.4%),
95% within +/- 2 SD, and
99.75% within +/- 3 SD.
That assumes a "normal" distribution, which is not really the case for equity returns.

There would also be an assumption of some associated time period like one year or daily. Morningstar ( Standard Deviation ) says they use monthly measurements and then annualize them. So they should be used as a yearly gain uncertainty.
 
jIMOh, where did you see this stat for this portfolo? SD of 9.9 percentage points seems like a HUGE numerber for a portfolio containg 45% bonds. I have an idea of what the 9.9 actually applies to but would like to see the data before commenting.
 
If you look at sources like Merriman's fundadvice, he reports standard deviations of 11.9% for a 60% SP500 and 40% bond portfolio. The OPs 9.9% seems consistent with that number.

Standard deviation is based on the squared difference, so it makes sense that it would be skewed by outliers
 
Despite the Central Limit Theorem, stock returns are not Gaussian, so one cannot use standard deviation to estimate future ranges of returns.

I would say that perhaps one can lose 50% to 100% of the equity portion of your portfolio in any given year and the probability of that is always very high.
 
What you want is the CAGR or Compound Annual Growth Rate. You can look up the formula but that smooths out the volatility created with simple averaging. Example: your funds go up 100% one year and the next year lose 50 % of the value. What is the average return? The arithmetic average is 25%... Very misleading. The return over that period is zero. CAGR corrects for the deviations.
 
I would say that perhaps one can lose 50% to 100% of the equity portion of your portfolio in any given year and the probability of that is always very high.
How about expanding on this assertion since it doesn't seem intuitive. I am always prepared to lose 50% of my portfolio and it happened to the equity portion once in my lifetime. But 50 - 100% with a high probability? What do you mean by a high probability? How does that probability apply as you approach 100%. And remember we were talking about balanced portfolios.
 
Last edited:
How about expanding on this assertion since it doesn't seem intuitive. I am always prepared to loose 50% of my portfolio and it happened to the equity portion once in my lifetime. But 50 - 100% with a high probability? What do you mean by a high probability? How does that probability apply as you approach 100%. And remember we were talking about balanced portfolios.
He is only referring to the equity portion of the portfolio. I would agree with the 50%, not so much more than that. In a 55/45 allocation that would amount to 27.5% total portfolio decline.
 
That assumes a "normal" distribution, which is not really the case for equity returns.
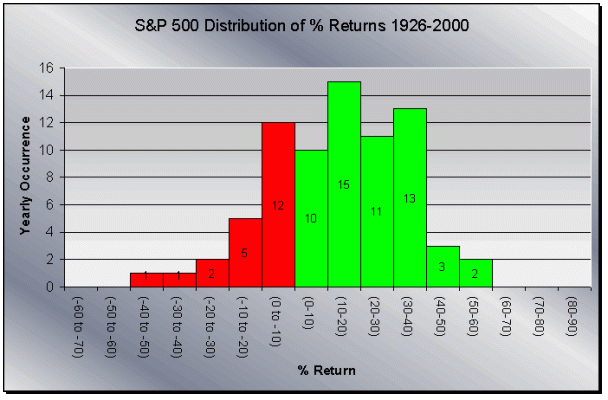
Here's some evidence that it's not a normal distribution. You would also have to predict sequence of returns, not a factor during accumulation but significant once withdrawals begin. Unfortunately you cannot predict sequence of returns.
 

Attachments

  • S&P500Distribution%20of%20Returns.gif
    S&P500Distribution%20of%20Returns.gif
    31.3 KB · Views: 4
Here's some evidence that it's not a normal distribution. You would also have to predict sequence of returns, not a factor during accumulation but significant once withdrawals begin. Unfortunately you cannot predict sequence of returns.


Actually that graph seems to be more normal than what people seem to say... heck, you can draw a nice bell curve and not be far off of the data presented.....
 
Actually that graph seems to be more normal than what people seem to say... heck, you can draw a nice bell curve and not be far off of the data presented.....
Sort of normal isn't the same as normal, looks trimodal if anything. And the graph covers a 74 year period, 30 years seems to be a norm for retirement duration. The distribution for a shorter period is likely to be even less normal.

And again sequence of returns has to be considered. You could have two series of returns with identical distributions (same standard deviations) that would result in completely different end of plan outcomes (from broke to rich).
 
Last edited:
As others have implied, standard deviation in stock or bond returns doesn't seem to get at the "feel" for the investment. Plus we have to worry about "fat tails", those way out (non-Gaussian) negative years like 2008.

Vanguard shows some portfolio compositions with best/worst years and number of negative years here:
https://personal.vanguard.com/us/insights/saving-investing/model-portfolio-allocations

IMO, a better way to view things. Remember too, returns high to low (or low to high) rarely fall on yearly boundaries. My favorite way of monitoring returns is to look at the past 12 months.

Professor Lsbcal at your service :greetings10:.
 
Last edited:
Despite the Central Limit Theorem, stock returns are not Gaussian, so one cannot use standard deviation to estimate future ranges of returns.

I would say that perhaps one can lose 50% to 100% of the equity portion of your portfolio in any given year and the probability of that is always very high.

This should give me an idea of what a single 1 year return will be.

If its -1.5% to +19% is what I can expect 66% of the time, I can accept that (based on past performance...)

If we did not use past performance to choose investments, then why would anyone ever invest any money?
 
Should be about
68% chance returns are +/- 1 SD (your first case -1.4% to 18.4%),
95% within +/- 2 SD, and
99.75% within +/- 3 SD.
That assumes a "normal" distribution, which is not really the case for equity returns.

There would also be an assumption of some associated time period like one year or daily. Morningstar ( Standard Deviation ) says they use monthly measurements and then annualize them. So they should be used as a yearly gain uncertainty.

I will check your link out shortly...

was my first set of math right? Add the standard deviation to the return and subtract it too to get the range for 66% of all cases (using past performance...)?

From your link (quoted from morningstar) it appears adding and subtracting std deviation to avg shows the range.

For example, for a fund with a mean annual return of 10% and a standard deviation of 2%, you would expect the return to be between 8% and 12% about 68%of the time, and between 6% and 14% about 95% of the time.

but later, this statement seems to contradict that math...

For example, Fund A has a standard deviation of 23.56%. This means that approximately 68% of the time, Fund A will be within 23.56% of its mean of 25.33.

23.56% of 25.33 is about 6 points (5.96). so is it 25.33+- 5.96 or 25.33+-23.56?
 
Last edited:
I will check your link out shortly...

was my first set of math right? Add the standard deviation to the return and subtract it too to get the range for 66% of all cases (using past performance...)?

From your link (quoted from morningstar) it appears adding and subtracting std deviation to avg shows the range.


but later, this statement seems to contradict that math...


23.56% of 25.33 is about 6 points (5.96). so is it 25.33+- 5.96 or 25.33=-23.56?

They are always talking percentage points +/- of mean gains, not percentage of mean gains.
 
Second opinions from other links

there's a 68% probability that the return in any year selected at random from the 10-year sample would be between -10.5% (13.4 - 23.9) and +37.3% (13.4 + 23.9).
This is how risk is viewed in the world of investing and why understanding standard deviation is so important. If you can assemble a portfolio that has a standard deviation equal to its expected return you will only have a 16% probability of losing money in any one year, (100% - 84% = 16%).

Mean & Standard Deviation: Analyzing Investment Returns

Except for the Treasury bill, the volatility is always greater than the average return. For the equity returns, the volatiity if very high. For example, for the S&P 500 equity portfolio, the average return is approximately 1% per month and the volatility is approximately 6%. A one standard deviation band around the mean covers -5% to +7%. If the data were normal, this covers 66% of the possible outcomes. A two standard deviation confidence interval would be -11% to +13% in any month. This shows that equity returns are very volatile.

WWWFinance - Historical Returns: Campbell R. Harvey
 
....I would say that perhaps one can lose 50% to 100% of the equity portion of your portfolio in any given year and the probability of that is always very high.

That doesn't make sense to me. If that were true, I think very few of us would be investing in equities (I don't think that I would)

Vanguard indicates that a 100% stock portfolio would have an average annual return of 10.0%, 25 years with a loss (of 84 years), a 41.3% loss in the worst year (1931) and 54.2% return in the best year (1933) based on historical returns from 1926-2010. So if 41.3% is the worst year during that period, I don't see how it would make sense that there is a high probability of losing 50-100% of the equity portion of your portfolio in any given year (at least based on historical return data).

I could see such large one-year losses being possible (but not even probable) for an individual stock, but not for a diversified portfolio of stocks. The graph posted by Midpack also shows only a couple years with losses that are even near that magnitude.
 
The use of statistics to describe and predict the future performance of investments verges on numerology as it is practised by many in the financial industry.
 
The use of statistics to describe and predict the future performance of investments [-]verges on[/-] is numerology as it is practised by many in the financial industry.
fify
 
That doesn't make sense to me. If that were true, I think very few of us would be investing in equities (I don't think that I would)

Vanguard indicates that a 100% stock portfolio would have an average annual return of 10.0%, 25 years with a loss (of 84 years), a 41.3% loss in the worst year (1931) and 54.2% return in the best year (1933) based on historical returns from 1926-2010. So if 41.3% is the worst year during that period, I don't see how it would make sense that there is a high probability of losing 50-100% of the equity portion of your portfolio in any given year (at least based on historical return data).

I could see such large one-year losses being possible (but not even probable) for an individual stock, but not for a diversified portfolio of stocks. The graph posted by Midpack also shows only a couple years with losses that are even near that magnitude.
The other factor is spending. For ER folks that combo of spending and equity/bond losses and inflation is ... a concern.
 
The other factor is spending. For ER folks that combo of spending and equity/bond losses and inflation is ... a concern.
That's what sequence of returns is all about.
 
I feel much more comfortable taking an "income" approach. I invest specifically for creating income. By doing this I always have a pretty good idea of where I stand.

Some will say that anything that diverges from the total return strategy, i.e. modern portfolio theory, is just fooling ones self, but I disagree.
 
That's what sequence of returns is all about.
Right, that's what FireCalc is all about. However, one should do a little simple arithmetic to see what that might mean in terms of short term shocks. Example, your net worth in August of 2008 and then again in late Feb 2009 with all several smart money managers talking about the SP500 going down possibly a lot more.

Somehow all the simulations in the world never prepare me for the emotional roller coaster of what I've signed up for. Everyone is probably a bit different in this regard.
 

Latest posts

Back
Top Bottom