Vanguard correlation matrix

IndependentlyPoor

Thinks s/he gets paid by the post
Joined
Jul 1, 2009
Messages
1,142
Location
Austin
I know that this risks putting me on many folk's "ignore user" list, but this forum just hasn't been nerdy enough lately.

So if anybody is interested, here is a correlation matrix of all of Vanguard's mutual funds (at least those that are available through the data server I am using).

Some notes and caveats:
1. Please don't base investment decisions on this without independent confirmation. I don't want a goof of mine to cause anybody to lose money.
2. I used all available data since inception of the funds, but some of them are so new that the data is not worth much. Again: be careful.
3. I hope the color coding is obvious, dark green for strongly anti-correlated, dark red for strongly correlated, and lighter colors for in-between.
4. I created this using Mathematica's financial data server and their built in correlation function.
5. The matrix is very large. You will have to zoom a lot.
View attachment VanguardCorrs.pdf
6. Here are correlations of Vanguard's Total Stock Market ETF to their other ETFs in table format
View attachment vETFs.pdf
 
Last edited:
Can you do a 3-way correlation and add in variable annuities ...

Now where did I put my Curmudgeon certificate?

:LOL: :LOL: :LOL:

heh heh heh - let's not get as nerdy as some of the Boglehead's threads -over there they get all serious and complex - even though I've layed a few snide - it really is that stone simple comments on them.

I'm saving pssst Wellesley for later. Now as to refianacing my 30 yr mortgage or early SS as a faux annuity substitute - :ROFLMAO: :greetings10: :whistle:.
 
That's great - NICE JOB!!!

and tomorrow you are going to do VG vs FI :LOL:??


THANKS!!!!!!
 
Actually very interesting.

Now for a rolling correlation update every three months - you can get back with us as they do change with time.

heh heh heh - I actually used this kind of data back in the day when I had REIT Index, Small Cap Value Index and High Yield Corp to side dress my Lifestragety moderate. :cool: Now - Target Retirement 2015 with a few dividend stocks as medicine for the hormones. Aka mostly full auto and lazy. ;)
 
Heh, heh. I can sense eyeballs glazing-over all across cyberspace.

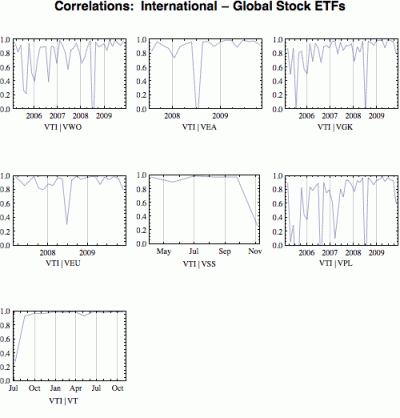
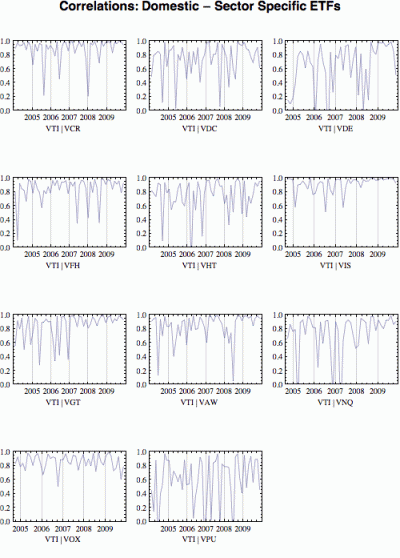
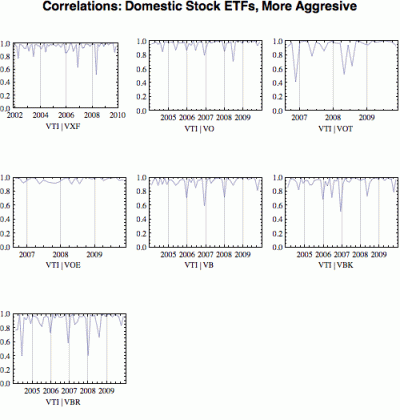
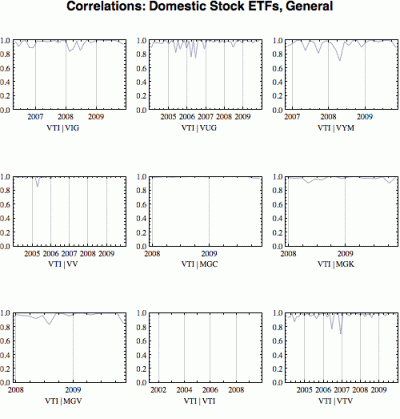
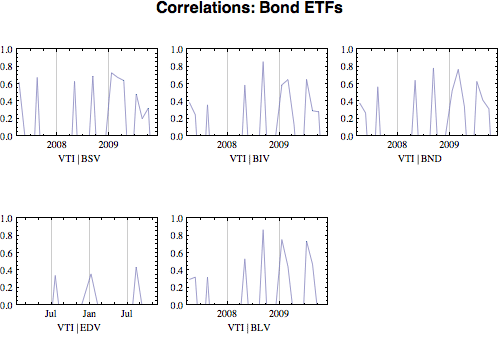
Here are graphs of rolling 50-day correlations of VTI vs other Vanguard ETFs. Folks like to say that correlations tend to unity in times of crises, but it seems to me that with the exception of bond fund, they are pretty high most of the time.

moving correlations- Global.gif

moving correlations- Sector Specific.gif

moving correlations- Domestic, more aggressive.gif

moving correlations- Domestic general.gif

moving correlations- bonds.gif

What can I say? I got a new copy of Mathematica and have too much time on my hands. :blush:
 
Last edited:
Ok... for someone who does not get into which fund is which....

Where is the decoder ring:confused:

(or, what funds are what ticker?)
 
Dumb question.... how do I decode your row and column headers into ticker symbols?
 
Very cool stuff. I'll definitely refer to it the next time I want to add/remove a fund from my portfolio. Thanks for sharing.
 
Oops

I did these correlations last month, and that is several weeks longer than my memory's half life. I though that I had done all Vanguard funds, but seems like I only did the ETFs. Sorry for the confusion.
 
I did these correlations last month, and that is several weeks longer than my memory's half life. I though that I had done all Vanguard funds, but seems like I only did the ETFs. Sorry for the confusion.
I was wondering where the tickers for mutual funds were hiding. I recognized some of the ETF tickers. :D
Nice job on the data presentation BTW. :flowers: It was a bona fide Engineer thang. ;)
 
Bumping my own thread again. :blush:

Here is a correlation matrix of Vanguard's non-ETF funds, not including money market funds. I believe there are 107 of them, so the matrix is HUGE. You will have to zoom in a lot. I labeled each cell with its row and column to make the thing a bit more useful.
Note: you can also use your PDF viewer's "find" feature.

I believe that these correlations are correct, but I am still checking. Please let me know if anything looks fishy.
View attachment Vanguard fund correlations.pdf
Here is a table of the ticker symbols
View attachment Vanguard fund index.pdf
And for sure, don't make any investment decisions based on this information without independent confirmation.
 
Is this correlation of daily returns? Annual returns?
 
Is this correlation of daily returns? Annual returns?
Daily, over the longest period possible during which each pair of funds exist, so some of the correlation pairs are over much longer periods than others.
 
Daily, over the longest period possible during which each pair of funds exist, so some of the correlation pairs are over much longer periods than others.

That probably explains why my own analysis produced different results. I looked at correlation of yearly performance and found the REIT fund to be less correlated with most other equity classes than what your results show.
 
First of all, thanks for the interesting thread. This is great! Especially the funds matrix. The ETFs are all pretty new and I personally do not value the short term correlations.
I find some things surprising. EM to S&P 500 for long periods .62. REIT to S&P 500 for long periods .68.
Do I find some things fishy? The Target Retirement funds as a group seem to have that great negative correlation to the equity markets. Even better than the bond funds. No facts here, just feelings.

Free to canoe

That probably explains why my own analysis produced different results. I looked at correlation of yearly performance and found the REIT fund to be less correlated with most other equity classes than what your results show.

I rechecked the REIT (VGSIX) , Emerging Markets (VEIEX), and S&P500 (VFINX) correlations sort of by hand. By that I mean that I downloaded new data and did each step separately instead of embedded in a program and got the same results.

I am not sure what Free to canoe means by great negative correlations of the Target Retirement funds. For example, using Target 2005 (VTOVS) and Target 2050 (VFIFX), I see the following correlations to Total Stock (VTSMX)
VTSMX/VFIFX: 0.99
VTSMX/VTOVX: 0.78
compared to Total Bond (VBMFX)
VTSMX/VBMFX: 0.56
Am I missing something here, or looking at the data crosseyed?

There are significant differences in the amount of data available for each fund. Here are the number of data points:
VTSMX 3445
VTOVX 1595
VTENX 924
VGSIX 3439
VFINX 5780
VEIEX 3641

For each correlation pair, I used data from inception of the youngest fund to Feb, 10, 2010 (the day I downloaded the dataset). I deleted the following dates from each series because some funds were missing these dates:
{{2001, 11, 22}, {2005, 6, 9}, {2005, 10, 24}, {2005, 10, 25}}

I will continue to check the correlations and post updates if I find anything significant.
 
I rechecked the REIT (VGSIX) , Emerging Markets (VEIEX), and S&P500 (VFINX) correlations sort of by hand. By that I mean that I downloaded new data and did each step separately instead of embedded in a program and got the same results.

This is a fine kettle of fish that I got myself into.

What I meant about the Vanguard EM and REIT .62 and .68 correlations to the Vanguard S&P 500 fund being surprising is not that the numbers are inaccurate but that they seem higher than some of the historical numbers used for emerging market and real estate correlations in general (according to my memory).

In the article Emphasizing Low-Correlated Assets: The Volatility of Correlation by William Coaker II in the Journal of Finance 2007 they list the correlations as .50 and .52. Lower but not really surprisingly lower. Recent historical events may have tended to bump them up.

Your recent research has given this untrusting soul some confidence in the Vanguard matrix.

I am not sure what Free to canoe means by great negative correlations of the Target Retirement funds. For example, using Target 2005 (VTOVS) and Target 2050 (VFIFX), I see the following correlations to Total Stock (VTSMX)
VTSMX/VFIFX: 0.99
VTSMX/VTOVX: 0.78
compared to Total Bond (VBMFX)
VTSMX/VBMFX: 0.56
Am I missing something here, or looking at the data crosseyed?

No, I am looking at the matrix crosseyed. Sorry.

Free to canoe
 
Some of the target funds and the short term bond funds have some of the strongest inverse correlations in the matrix.
Specifically, the Target Retirement 2030, Target R. 2040 and Target R. 2050 and the first 5 funds in the matrix. Why are Target R. 2025, 2035 and 2045 somewhat lower than their sister funds?

Free to canoe
 
I was going cross-eyed looking at the huge correlation matrix so I am trying some other ways of presenting the data.
Here is a pdf of all 5671 correlations, sorted with the negative correlations first. The 4th column is the number of data points included in the correlation. The 5th column is the correlation itself.
View attachment Vanguard correlation table.pdf
I found it interesting the Market Neutral Fund (VMNFX) appeares in the first 9 places. The 9th place is also interesting because it is a pair of equity funds with high negative correlation, although the small number of data points casts doubts on its reliability.

The "obvious" VTSMX/VBMFX combination doesn't show up until #1104 with a positive correlation of about 0.56. In fact, this correlation is much worst than the VWUSX/VTSMX combination at #675 with a correlation of about 0.31. Unless there is an error lurking in my correlations, this must be due to the tremendous hit that US Growth took in 2000 and its subsequent non-recovery

Also attached are correlation tables for VTSMX and VBMFX. These are essentially rows (or columns) from the big correlation matrix. I find it interesting (almost impossible to believe) that VTSMX is positively correlated with all the other funds.
View attachment Vanguard VTSMX correlation table.pdf
View attachment Vanguard VBMFX table.pdf
 
I was going cross-eyed looking at the huge correlation matrix so I am trying some other ways of presenting the data.
Here is a pdf of all 5671 correlations, sorted with the negative correlations first. The 4th column is the number of data points included in the correlation. The 5th column is the correlation itself.
View attachment 8387
I found it interesting the Market Neutral Fund (VMNFX) appeares in the first 9 places. The 9th place is also interesting because it is a pair of equity funds with high negative correlation, although the small number of data points casts doubts on its reliability.

The "obvious" VTSMX/VBMFX combination doesn't show up until #1104 with a positive correlation of about 0.56. In fact, this correlation is much worst than the VWUSX/VTSMX combination at #675 with a correlation of about 0.31. Unless there is an error lurking in my correlations, this must be due to the tremendous hit that US Growth took in 2000 and its subsequent non-recovery

Also attached are correlation tables for VTSMX and VBMFX. These are essentially rows (or columns) from the big correlation matrix. I find it interesting (almost impossible to believe) that VTSMX is positively correlated with all the other funds.
View attachment 8388
View attachment 8389
Um...first pdf was all white space. :( I zoomed out to be sure.
2nd and 3rd pdf files both contained data.
 
Back
Top Bottom