FIRECalc and current inflation question

Lawrence of Suburbia

Recycles dryer sheets
Joined
Mar 30, 2009
Messages
208
Location
Newcastle, WA
(My question only relates to the basic, 3 parameter FIRECalc -- spending, portfolio size, years.)

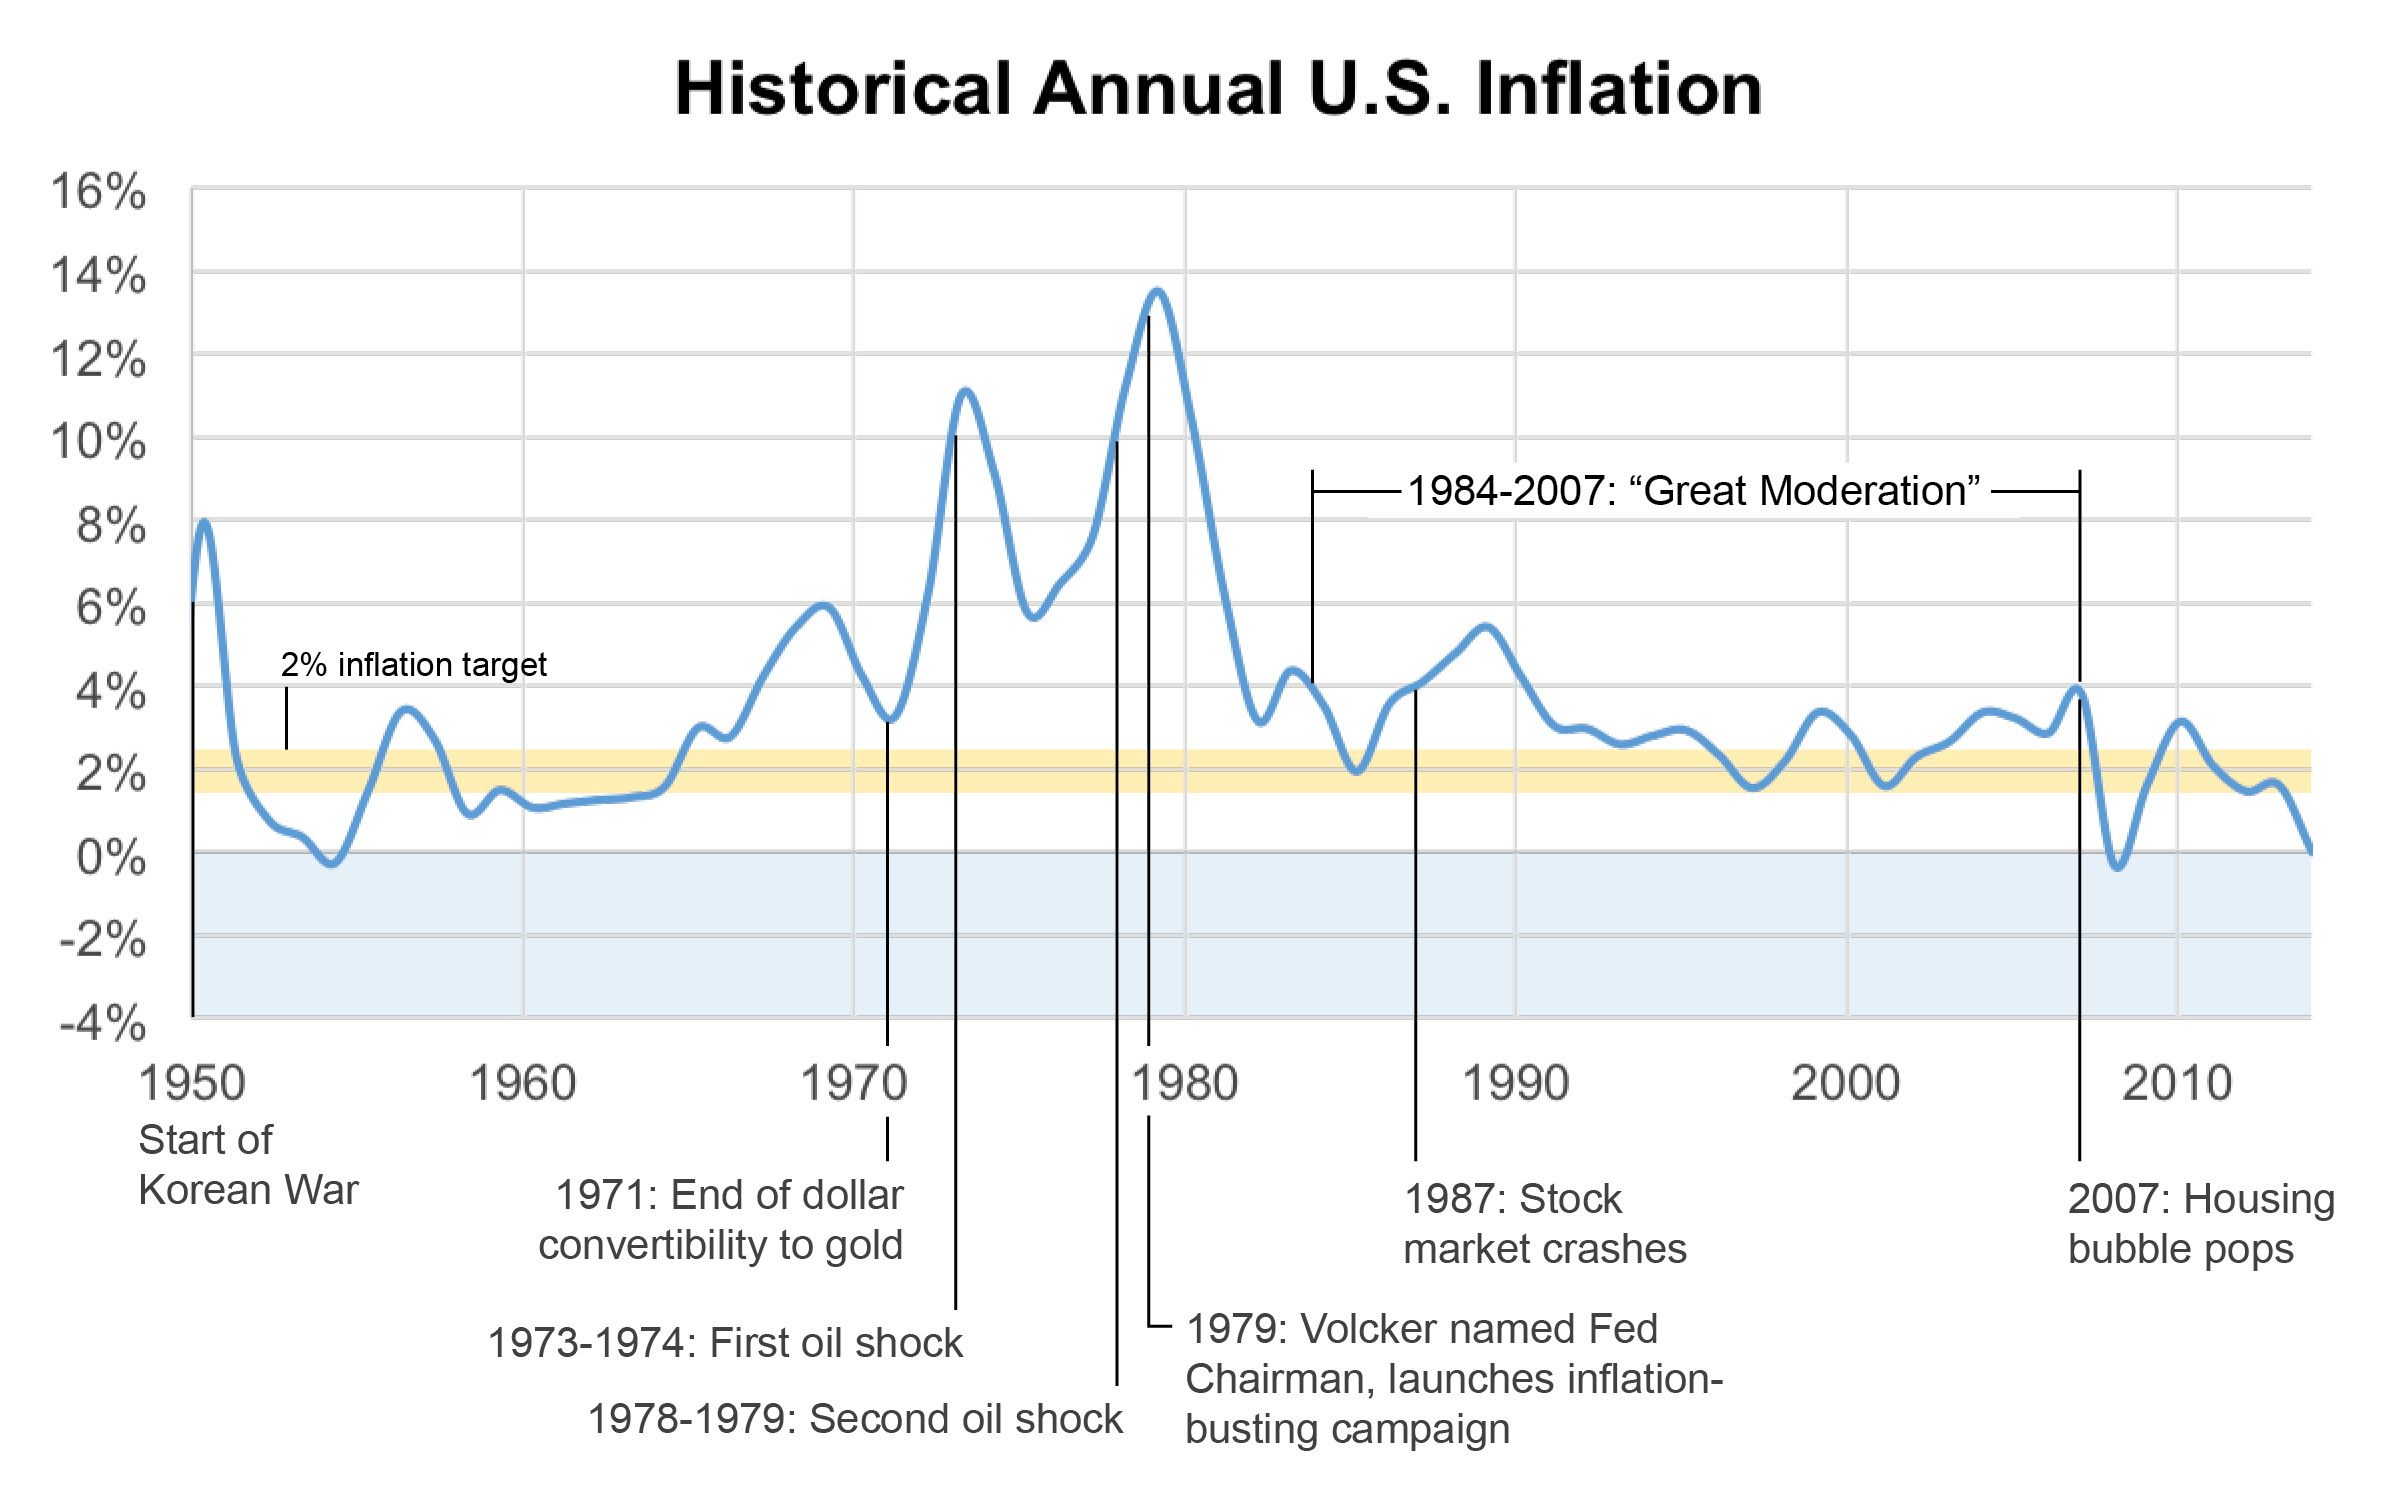
Does FIRECalc include current 2022 inflation in it's calculations? Or does it assume the 'normal' 2-3% inflation we'd gotten used to over the last few decades?

(I have no idea how the thing works.)
 
Last edited:
Just as FIRECALC uses actual historical market growth, dividends, investment expenses, and interest on your fixed income investments - it also factors in historical actual inflation for each year. So some previous inflation spikes are included such as the 70’s and early 80’s for one along with many periods with inflation greater than “2-3%.” 2022 inflation rates will become part of the underlying FIRECALC data as long as annual updates continue.

While 2-3% may not be the long term average, current inflation rates won’t continue forever either. If they do somehow, we’re all going to have a tough time planning for it.

FIRECALC said:
First, FIRECalc models a retirement year
  • FIRECalc starts with your nest egg, and takes out the amount of money you said you need to live on (after calculating how inflation would have affected your cost of living for that year).
  • Then, FIRECalc computes what would have happened to the remainder of your portfolio for that year, with market growth, dividends, investment expenses, and interest on your fixed income investments.

Historical_Annual_U.S._Inflation.jpg
 
Last edited:
Just as FIRECALC uses actual historical market growth, dividends, investment expenses, and interest on your fixed income investments - it also factors in historical actual inflation for each year. So some previous inflation spikes are included such as the 70’s and early 80’s for one along with many periods with inflation greater than “2-3%.” 2022 inflation rates will become part of the underlying FIRECALC data as long as annual updates continue.

]

Off topic but I must say, Midpack, you always have the best collection of charts! A picture is worth a thousand words!
 
Off topic but I must say, Midpack, you always have the best collection of charts! A picture is worth a thousand words!
+1 and I'm also equally impressed with posting at 4 AM from the east coast.:)
 
Thanks for that info!

I'm gonna just stagger onwards with my current 3.3% withdrawals, adjusting for cost increases as needed, I suppose.
 
Last edited:
Back
Top Bottom