Bond Yield Curve Flattening ???

It's very possible. 10-year has backed way off with yield currently at 2.847%. Two weeks ago I heard stories that it could fall all the way back to 2.6% near-term.

I try not to get too caught up with what is happening, and simply pick up maturities all along the curve. That means biting my tongue and periodically picking some up at 5 years, 10 years, and even a bit further out. Those yields/maturities are somewhat difficult to swallow when looking at short term rates. However, it's important to remember that we do not know where rates will top out. There are numerous reasons why rates cannot go significantly higher. It's also important to think back where rates were only a year or two ago. Remember - Congress was attacking Yellen because she refused to take rates negative like the rest of the world. When you consider the current yields in the context of where we've recently been, current rates around the world, and that US rates could head lower again, 3% and higher for 5 to 10 years is not so terrible.
 
Recession has followed in all cases but one since 1960. The time lag is 9 months to 2 years. History may or may not repeat itself. If you can time it perfectly, please advise me also. Then please let me know when to get back into the market as it hits bottom. :popcorn:
 
Recession has followed in all cases but one since 1960. The time lag is 9 months to 2 years. History may or may not repeat itself. If you can time it perfectly, please advise me also. Then please let me know when to get back into the market as it hits bottom. :popcorn:

Yes, there is usually a delay before the recession comes (as you note). There is also usually a delay before the markets top.
 
Recession has followed in all cases but one since 1960. The time lag is 9 months to 2 years. History may or may not repeat itself. If you can time it perfectly, please advise me also. Then please let me know when to get back into the market as it hits bottom. :popcorn:

I know all the recent recessions have had the inverted curve happen before the event, but has all inverted curves been followed by a recession, or is that your statement except in one case?
 
I know all the recent recessions have had the inverted curve happen before the event, but has all inverted curves been followed by a recession, or is that your statement except in one case?

In the last 60 years, there was only once that the yield curve inverted with no recession following within 1-2 years. That was around 1964 by memory but in the 60s. It has been a fairly reliable indicator in the last 60 years.
 
Then please let me know when to get back into the market as it hits bottom. :popcorn:

Watch the VIX. It rarely goes above 30 and in extreme cases it has gone over 50, even 75. Every one of those instances were excellent entry points into the market. So there is your answer on when to get in. Buy when the VIX is high.
 
Last edited:
Recession has followed in all cases but one since 1960. The time lag is 9 months to 2 years. History may or may not repeat itself. If you can time it perfectly, please advise me also. Then please let me know when to get back into the market as it hits bottom. :popcorn:

I heard a bond expert on Fidelity yesterday say 2 to 24 months from inversion to recession. So apparently it can happen quickly.
 
It has been killing the bank stocks, the XLF has been down 12 straight days not including today! I am in the camp that the curve will widen in the fall?
 
It has been killing the bank stocks, the XLF has been down 12 straight days not including today! I am in the camp that the curve will widen in the fall?

It might. It depends on a lot of things. The Fed getting close to reaching max balance sheet windown rate which means a lot more supply of bonds which should increase rates, plus inflation has been creeping up lately. On the other hand, reduced economic activity or perceived future hits to economic activity such as tariffs, could keep long term rates down. Indicators change monthly!
 
I've mentioned before (in other threads) that you can have a "Bear market" without a recession. A good example is the Chinese market which just entered there 3rd Bear market since 2000 a few days ago. Interestingly the chart of the FXI looks a lot like the S&P over the last 18 years. Also, the talk of trade war has had a far more significant effect on their markets than ours. I have been selling off my Chinese holdings (a bit too late) as there looks to be another 20% downside and a year or so before it turns around.
 
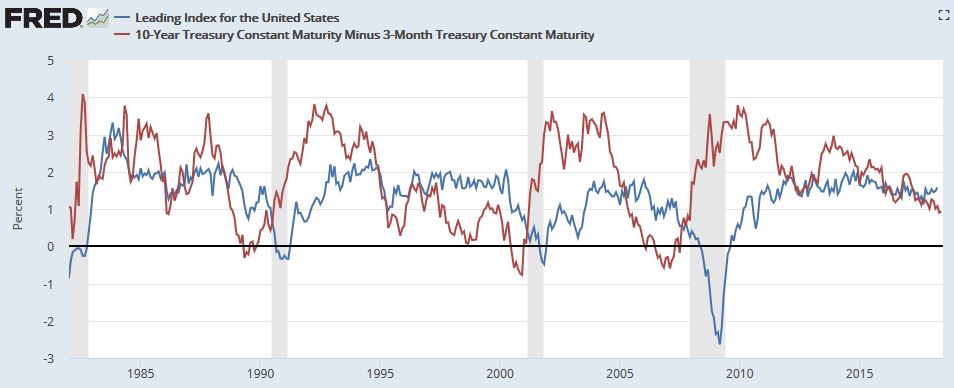
I think the Fed has been identified with using the 10 year minus the 3 month Treasury to look at yield curve flattening. Below is a nice Fed chart showing the entry into the last 3 recessions (grey shaded areas). You can see how the flattening (red line below X axis) has been a very early indicator of trouble but not an actionable timing signal I think. Also at present it is pretty far from flat. The 10year minus 2 year is closer to flat and so that becomes a focus of scare articles.

Perhaps a better timing signal is the Leading Index (blue line) falling significantly. At present it is benign.


Capture.jpg

.
 
Have we topped out and looking forward to an inverted yield curve soon ?

My crystal ball is a bit foggy this morning ?

What's a flattening yield curve and why it should scare you

Back in February when I gave my views on where interest rates were headed (i.e. flattening yield curve and then inversion), some agreed but most dismissed it as crazy. Not so crazy anymore. We are still in the early innings of the retail apocalypse. Sears and JC Penny are still alive will continue to shut more and more stores creating more empty malls. Defaults in commercial loans will start hitting regional banks hard. Even Barron's is now forecasting another round of QE in the future.
 
... The time lag is 9 months to 2 years. ...
There are thousands of parameters around, everything from the price of salt in Madagascar to the yield curve du jour. It is no wonder that one can find positive correlations between many of them by looking in the rear view mirror.

The fact that this particular correlation is so weak that one must ignore huge lags in order to even detect it does not cause me to worry very much. Its principal value, IMO, is probably as click-bait for guys like "the bond expert at Fidelity."

Predictions are difficult, especially about the future.:popcorn:
 
Where's the flat bit of which we speak?

35183-albums227-picture1661.png


Now, Jan 2008, that is quite frightening.

35183-albums227-picture1662.png
 
Last edited:
Its principal value, IMO, is probably as click-bait for guys like "the bond expert at Fidelity."

Predictions are difficult, especially about the future.:popcorn:

If you want to take pot shots at prior posts, it was an answer to a question during a presentation by Fidelity bond guys. Not a link to an online article presented as “click bait” by Fidelity.
 
Where's the flat bit of which we speak?


The flat bit is from 2 or 3 years on. Why do you think folks are all over every CD thread saying they are gobbling up 2 and 3 year CDs and not willing to go any further out?

When you make the entire scale from 0% to 3% it's not going to look flat. Make the scale 0% to 10% in the same size and it will look plenty flat.

The point is, going from 2 or 3 years to 30 years you get an increase of less than 0.5% - that is ridiculous for over 25 years additional. The short end continues to move higher, and the long end is not moving higher - the curve will go (relatively) flat, and likely invert.
 
I think the Fed has been identified with using the 10 year minus the 3 month Treasury to look at yield curve flattening. Below is a nice Fed chart showing the entry into the last 3 recessions (grey shaded areas). You can see how the flattening (red line below X axis) has been a very early indicator of trouble but not an actionable timing signal I think. Also at present it is pretty far from flat. The 10year minus 2 year is closer to flat and so that becomes a focus of scare articles.

Perhaps a better timing signal is the Leading Index (blue line) falling significantly. At present it is benign.


Capture.jpg

.

FWIW I thought that 10 year compared to 2 year was the conventional measure of curve flatness?
 
I'll wait until it inverts before I get all panicky.

35183-albums227-picture1663.png
 
As a long term buy-and-hold investor with a preference for equity index funds, I’ve been in Vanguard Target Retirement 2025 for about 5 years. But since I’ll be 65 in a week (now working part-time), I don’t want to be heavily in equities as I gradually retire in the next year or two, possibly on the cusp of a recession or especially, a bear market.

So yesterday I moved into the TR2020 fund. But that’s still over 50% equities. I try really hard to stay the course, but at this age I sure don’t want to get caught retiring into a bear market. I’m about to roll over my 401(k) (now in equities) into Vanguard. Maybe I’ll park it in bonds and cash, and following Kitces, move back into more equities after I quit working altogether (working p/t now).

Sigh. I vowed never to time the market, but it does seem like this pre-retirement phase deserves a more conservative allocation.
 
Last edited:
Sigh. I vowed never to time the market, but it does seem like this pre-retirement phase deserves a more conservative allocation.


It does, because sequence of returns risk is very real and you might not otherwise seriously consider it until it's too late.

There are a couple of issues/items to consider that should give you pause:

1. If a market downturn should happen, will you need to be drawing on the invested funds? When you draw on the invested funds during a downturn, you are locking in losses at that time - those (permanent) losses will not be made back if/when the market recovers. As you draw down during a market down turn, a fixed withdrawal amount will translate into a higher percentage of portfolio value.

2. What happens most recently in the market is going to have the greatest effect on your portfolio value, as it is applied to all prior contributions and gains. This is the basis of sequence of returns risk and why folks should move to a more conservative allocation as they near/reach retirement. You want that lifetime of contributions and gains to be able to carry you through retirement. Putting lots of it at risk is not justified for most folks.

3. In general, I find talk is cheap. Many folks easily say "Oh when the crash comes, I'll just stay the course, keep investing, and do just fine longer term - it's always worked out". Ask anyone near retirement who was too heavily invested in 2008 how that plan worked out. Honestly ask yourself where your threshold for pain is. Suppose you just retired, have $1M with a 50/50 allocation. The equity portion declines by 50% and the bonds stay flat. Now you're at $750k. Things aren't so rosy any longer. That's 50/50 - many swinging a big stick laugh at 50/50 and even 75/25...again, until it's too late. You'll see many folks very confident in their posts, freely handing out investment advice, what to invest in, laughing at folks who are conservative, using high equity allocation because they are doing so well with it ... today. That's what happens at market highs when things are going well. Avoid getting swept up in the euphoria.

Investment objective and risk tolerance - address those honestly and you'll be fine.
 
Last edited:
It does, because sequence of returns risk is very real and you might not otherwise seriously consider it until it's too late.

There are a couple of issues/items to consider that should give you pause:

1. If a market downturn should happen, will you need to be drawing on the invested funds? When you draw on the invested funds during a downturn, you are locking in losses at that time - those (permanent) losses will not be made back if/when the market recovers. As you draw down during a market down turn, a fixed withdrawal amount will translate into a higher percentage of portfolio value.

2. What happens most recently in the market is going to have the greatest effect on your portfolio value, as it is applied to all prior contributions and gains. This is the basis of sequence of returns risk and why folks should move to a more conservative allocation as they near/reach retirement. You want that lifetime of contributions and gains to be able to carry you through retirement. Putting lots of it at risk is not justified for most folks.

3. In general, I find talk is cheap. Many folks easily say "Oh when the crash comes, I'll just stay the course, keep investing, and do just fine longer term - it's always worked out". Ask anyone near retirement who was too heavily invested in 2008 how that plan worked out. Honestly ask yourself where your threshold for pain is. Suppose you just retired, have $1M with a 50/50 allocation. The equity portion declines by 50% and the bonds stay flat. Now you're at $750k. Things aren't so rosy any longer. That's 50/50 - many swinging a big stick laugh at 50/50 and even 75/25...again, until it's too late. You'll see many folks very confident in their posts, freely handing out investment advice, what to invest in, laughing at folks who are conservative, using high equity allocation because they are doing so well with it ... today. That's what happens at market highs when things are going well. Avoid getting swept up in the euphoria.

Investment objective and risk tolerance - address those honestly and you'll be fine.
+1 Great advice. I am 2 years from retirement and I am at 35/55/10. Having moved to that mix gradually over about the last year and I have missed almost nothing in the equity market. Sometimes I think even that AA is too aggressive. :LOL: I plan to sit tight until I retire and then rebalance slowly back into equities over the next 5-7 years.
 
Back
Top Bottom