Buy & hold or simple system…. portfolio strategy feedback

2Black

Dryer sheet wannabe
Joined
Nov 15, 2017
Messages
21
Hi guys,

Short: would like your feedback on below portfolio strategy.

I finally got around reading ‘a random walk down wall street’ and I like it a lot.
The one thing I don’t like is the performance of the buy & hold strategy chapter 15 etc.
So I played around with a portfolio created on this site https://www.portfoliovisualizer.com/ somebody here mentioned a while back (again thanks for that).

My objective was:
-stick close to the buy & hold strategy used in the book
-low maintenance
-use only a few etf’s (keep it simple)
-stick close to the x% shares + y% bonds strategy
-minimum trading (less costs/less time)
-improve the big drawdown’s like 2008
-used ETF’s that go back in data before 2008 to include the big dip.

So I started with:
30% AGG (bonds)
60% SPY (sp500)
10% GLD (gold)

The buy and hold of these 3 give me a nice performance.
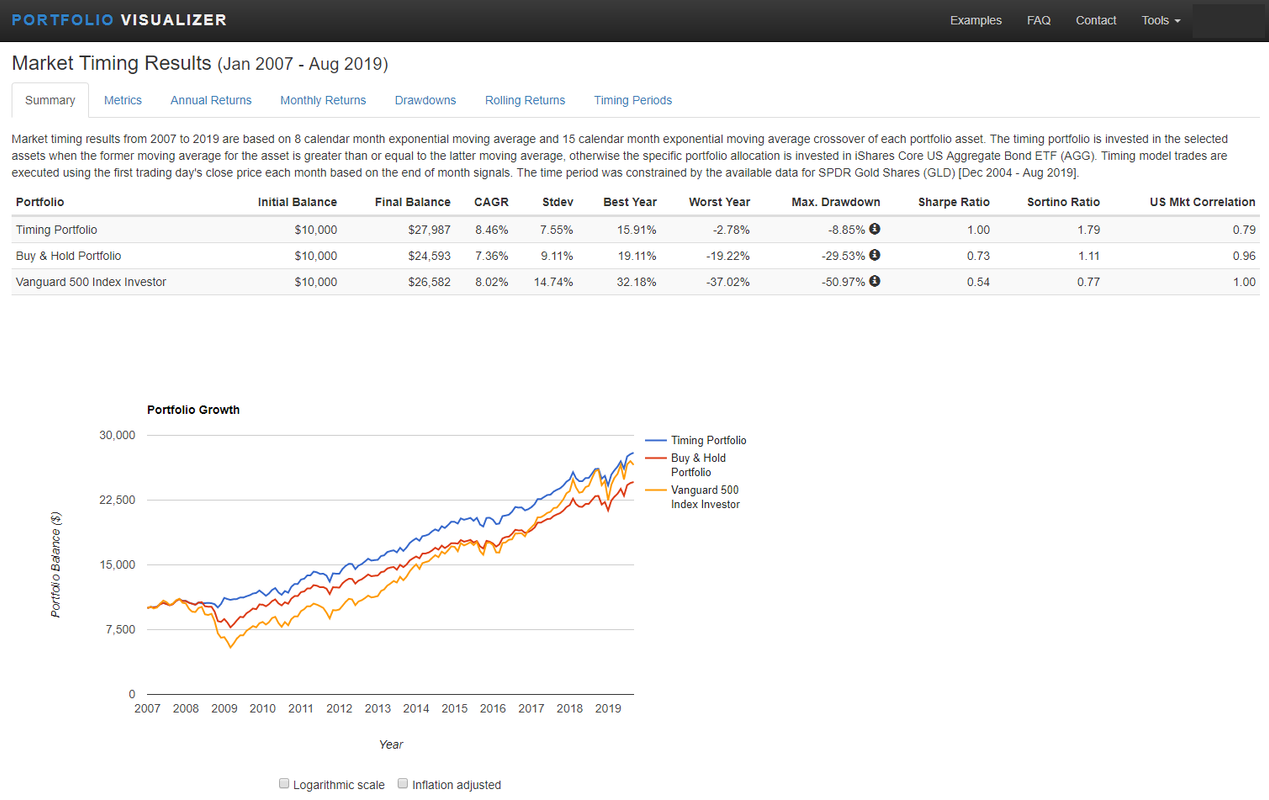
The big drawdown in 2008 is improved from -50.9% to -29.5%, overall CAGR changes from 8.02% to 7.36%
I can live with the reduced CAGR but -29% is still quite a bit (too much for my taste)
When I add a simple moving average timing model it improves further to max drawdown -8.85% and CAGR=8.46%
The total trades from jan 2007 till now is 9 and if you change from monthly trade to bi-monthly it hardly effects performance and brings down the trades to 7.
Changing the parameters for the moving average by a few months also doesn’t change much on the performance which I see as a good thing meaning its more robust and not over fitted.

I know you can’t see the future and back testing only works so much, but still…
Any arguments why I should not use this?

All feedback welcome,

ss-portfolio-visualizer-forum.png
 
If you're comfortable with it, that's most important along with your fortitude to stick with it when the downturn is eventually upon us. As you rightly allude, past performance is not a guarantee of future results. When the next crash comes along, it could be very different from those of the past. Today, we have a bubble in everything - stocks, bonds, and even gold has been climbing most of the year - with the stock market near record highs. This is quite a combination taking place.
 
Last edited:
I don't bother with gold.... while it certainly helped a little during the Great Recession it has historically underperformed for many other periods. Even during the Great Recession it only marginally reduced the drawdown.

The difference between the 50.8% and 29.5% drawdown is due to the replacement of stock with bonds.... bonds add stable "ballast" to the portfolio. Remember, the 29.5% was brief and was related to the worst economic crisis in our lifetimes and for more typical recessions the drawdown would be more benign.

Nonetheless, if 29% spooks you, decide what doesn't spook you and then add bonds until you get to a drawdown that you can live with... note that even 100% AGG had a 4% drawdown and 40/60 was 19%.

All of that said, a 60/40 AA which is essentially what you have here is fairly typical and close to what I target.
 
Most portfolio planning mentioned would have a buffer to absorb a 30% drawdown and remain confident in one's AA.
How did you feel in Dec 2018 with the 20% drawdown?
 
I am curious about this "timing model" and how it works exactly? Would it require that the funds be tax deferred to eliminate capital gains from the 7 trades you discussed?
 
thanks.

i changed the ETF's to versions with more historical data.
and removed GLD (couldn't find one with longer history)
results below, even less trades.

regarding te dec '18 20% drop, for me it was -8.5% which was fine. 10% dd is ok, but the 30 or 50% freak me out ;-)

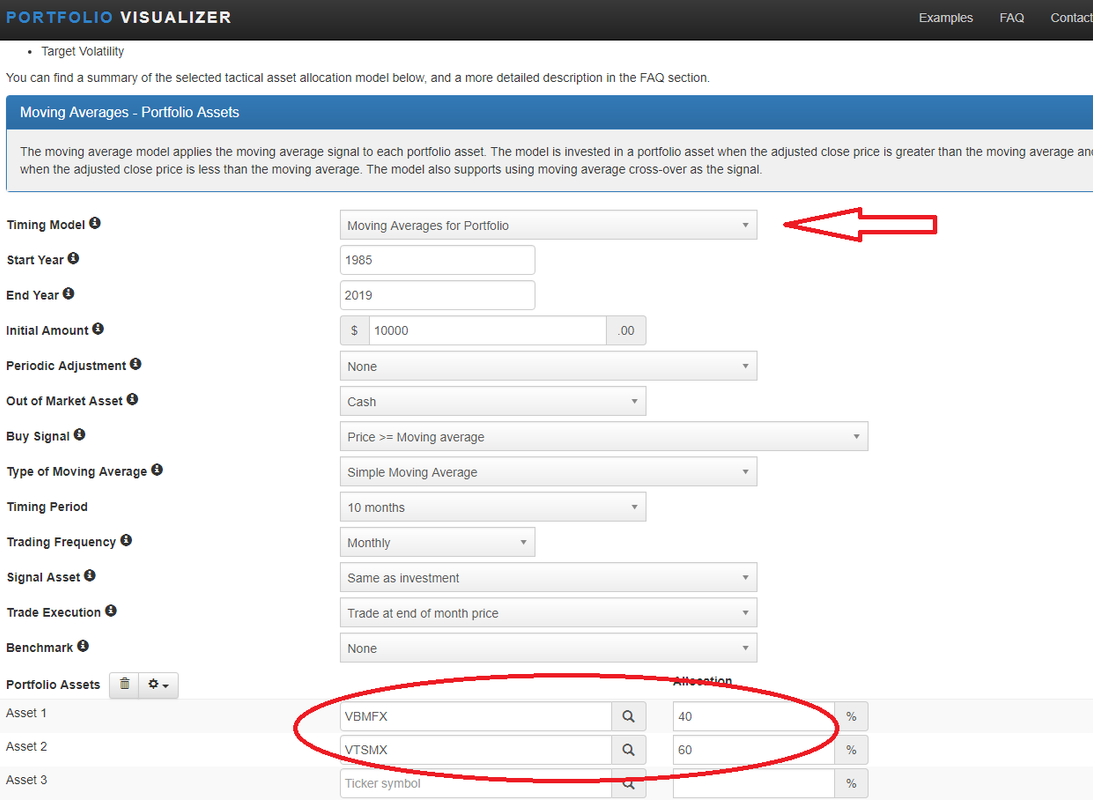
@vanwinkel, check the site/link mentioned, than choose market timing
lots of fun stuff to play with.
also see image below with specific trades/timing.

ss-portfolio-visualizer-forum-02.png


ss-portfolio-visualizer-forum-03.png
 
Thank you for the info. It would still seem to make a difference if the funds were tax deferred in this case as you are selling all equities and moving to bonds only for a period of time. There may be tax consequences that would out weight the benefits in a taxable brokerage account. 1/2 of my assets are in a taxable account so it does make a difference to me.
 
You are inching towards a trend following system. Personally I think it is a good idea but I'm in the small minority here.

For a very long (19 pages worth to date) discussion on trend following there is an ongoing Boglehead thread at: https://www.bogleheads.org/forum/viewtopic.php?f=10&t=270035

I'd say try reading that thread as it will not only give you ideas but also many contrary arguments.
 
... Any arguments why I should not use this? ...

... you can’t see the future and back testing only works so much …
You have answered your own question!

What you are really looking for here is permission to play with your food. I tell the students in my investing class that investing is boring and, if you're not bored, you're not doing it right. Clearly, you're bored.

So, hey, go ahead! Carve out maybe 10% of your stash to try your scheme(s) and leave the rest alone. Carefully benchmark the two approaches going forward through one or two market cycles and see how things turn out.

Good job reading Malkiel. For your next read, I suggest Nate Silver's "the signal and the noise -- why some predictions fail and some don't." Pay particular attention to the problem of "overfitting" and to the material on economic forecasting. If you're a baseball fan, you'll enjoy his baseball stuff but it can be skipped completely if you find it boring. With the elections coming up you'll probably enjoy his discussion of political polling and projecting, too.
 
thanks.

i changed the ETF's to versions with more historical data.
and removed GLD (couldn't find one with longer history)
results below, even less trades.

regarding te dec '18 20% drop, for me it was -8.5% which was fine. 10% dd is ok, but the 30 or 50% freak me out ;-)

@vanwinkel, check the site/link mentioned, than choose market timing
lots of fun stuff to play with.
also see image below with specific trades/timing.

ss-portfolio-visualizer-forum-02.png


ss-portfolio-visualizer-forum-03.png

Bolded by me - so it sounds like you would be okay with a 23-24% equity market drop, but not 30%.
It might a little more psychological fear to some extent, but only you can sleep well at night in the end.
 
One has to know that PortfolioVisualizer uses only monthly data, so as far as it is concerned, December 2018 with a 20% drop didn't really happen because markets went up that last week to end the month down 6% to 8% or so.
 
One has to know that PortfolioVisualizer uses only monthly data, so as far as it is concerned, December 2018 with a 20% drop didn't really happen because markets went up that last week to end the month down 6% to 8% or so.

Even with trend following there is pain and fear. Using monthly data cuts down on decision points and is usually (but not guaranteed to) smooth out the very sharp drops.

In the Bogleheads thread I mentioned above the OP uses unemployment data to remove sharp drops due to non-recessionary issues. In my opinion, and I mentioned it in that thread, he made a mistake in his use of the unemployment data which resulted in a whipsaw in January. But as he points out over a period of many years this stuff smooths out.

I think there are smart ways to employ trend following that can reduce whipsaws. Now for buy-hold there is only one way to design it, but still people worry about slice/dice, etc.
 
You are inching towards a trend following system. Personally I think it is a good idea but I'm in the small minority here.

For a very long (19 pages worth to date) discussion on trend following there is an ongoing Boglehead thread at: https://www.bogleheads.org/forum/viewtopic.php?f=10&t=270035

I'd say try reading that thread as it will not only give you ideas but also many contrary arguments.

thanks for the link, i'll have a look!
 
One has to know that PortfolioVisualizer uses only monthly data, so as far as it is concerned, December 2018 with a 20% drop didn't really happen because markets went up that last week to end the month down 6% to 8% or so.

I didn't know that (monthly data), thanks.
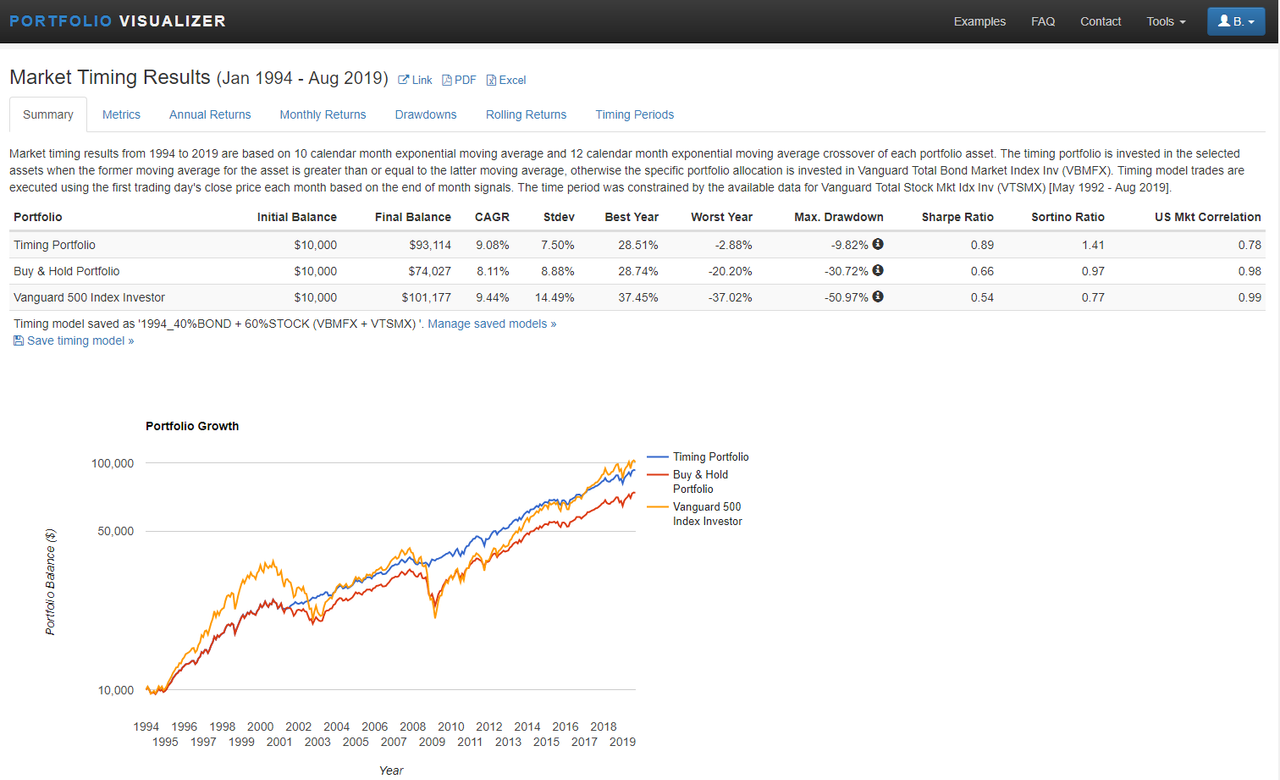
I was planning to simulate it anyway since i'm not sure if this strategy balances the portfolio (in this case stock vs bonds) and on what basis. i assume it re-balances yearly but it doesn't mention it.
other portfolio systems (on same site) mention it separate you can turn re-balance on and off but not so on this market timing test.

There are numerous rebalancing options included in Portfolio Visualizer.... none, annually, semi-annually quarterly, monthly and rebalance bands.
 
^^^ I don't see how rebalancing would apply for market timing schemes.... if one is market timing I'm not sure if rebalancing makes sense at all so that may be why there isn't a rebalancing option.
 
^^^ I don't see how rebalancing would apply for market timing schemes.... if one is market timing I'm not sure if rebalancing makes sense at all so that may be why there isn't a rebalancing option.

hmm, but what if you choose the portfolio option there?
and use 40% bond & 60% stock.
would you want to rebalance those once a year?
otherwise after 1 or x years, its not 40/60 anymore, since stock most likely will grow faster...
 
Dunno... I would never go that extreme... it says:
The moving average model applies the moving average signal to each portfolio asset. The model is invested in a portfolio asset when the adjusted close price is greater than the moving average and the allocation is moved to cash when the adjusted close price is less than the moving average.

So when the trigger is met the investments are "rebalanced" to either 40/60 or 100/0 and the resulting portfolio waggles around depending on market performance until the next trigger is met.... I don't know of anyone on these boards who would adopt such an extreme approach to retirement investing.
 
Last edited:
Dunno... I would never go that extreme... it says:


So when the trigger is met the investments are "rebalanced to either 40/60 or 100/0 and the resulting portfolio waggles around depending on market performance until the next trigger is met.... I don't know of anyone on these boards who would adopt such an extreme approach to retirement investing.

i agree. Last trade on that bond/stock setup was 2010 so 9 year ago, too long for not re-balancing
 
I don't see why rebalancing cannot be done on a trend following approach just like a buy-hold portfolio. I do it all the time in non-taxable accounts.
 
Back
Top Bottom