 |
|
 01-26-2020, 05:24 PM
|
#181
|
|
Thinks s/he gets paid by the post
Join Date: Sep 2006
Posts: 2,844
|
|

|

|
 |
Join the #1 Early Retirement and Financial Independence Forum Today - It's Totally Free!
Are you planning to be financially independent as early as possible so you can live life on your own terms? Discuss successful investing strategies, asset allocation models, tax strategies and other related topics in our online forum community. Our members range from young folks just starting their journey to financial independence, military retirees and even multimillionaires. No matter where you fit in you'll find that Early-Retirement.org is a great community to join. Best of all it's totally FREE!
You are currently viewing our boards as a guest so you have limited access to our community. Please take the time to register and you will gain a lot of great new features including; the ability to participate in discussions, network with our members, see fewer ads, upload photographs, create a retirement blog, send private messages and so much, much more!
|
BDI INDEX down 78% from July
|
01-27-2020, 02:46 PM
|
#182
|
|
Thinks s/he gets paid by the post
Join Date: Sep 2006
Posts: 2,844
|
BDI INDEX down 78% from July
|
|
|
|
|
01-27-2020, 03:38 PM
|
#183
|
|
Recycles dryer sheets
Join Date: Jul 2014
Posts: 333
|
These charts would be a lot more interesting if you would add some comments to explain we're supposed to take away from the chart. Maybe I'm the only one though, and everyone else gets it.
|
|
|
|
|
01-27-2020, 04:07 PM
|
#184
|
|
Full time employment: Posting here.
Join Date: Nov 2008
Location: Louisville
Posts: 601
|
 Quote: Quote:
Originally Posted by prudent_one

These charts would be a lot more interesting if you would add some comments to explain we're supposed to take away from the chart. Maybe I'm the only one though, and everyone else gets it.
|
I believe the BDI is a shipping index. One could assume if it's going down, fewer goods are being shipped around the world. But I may be incorrect.
|
|
|
|
|
01-27-2020, 05:08 PM
|
#185
|
|
Give me a museum and I'll fill it. (Picasso)
Give me a forum ...
Join Date: Dec 2008
Location: On a hill in the Pine Barrens
Posts: 9,720
|
To me. the index appears to be cyclical, and back to level of 2018/2019 changeover. That is my first glance.
|
|
|
|
|
01-27-2020, 05:18 PM
|
#186
|
|
Give me a museum and I'll fill it. (Picasso)
Give me a forum ...
Join Date: Dec 2008
Location: On a hill in the Pine Barrens
Posts: 9,720
|
Quote:
Originally Posted by prudent_one
These charts would be a lot more interesting if you would add some comments to explain we're supposed to take away from the chart. Maybe I'm the only one though, and everyone else gets it.
|
This link has explanation with a chart.
https://tradingeconomics.com/commodity/baltic
|
|
|
|
|
01-28-2020, 05:03 AM
|
#187
|
|
Thinks s/he gets paid by the post
Join Date: Sep 2006
Posts: 2,844
|
Quote:
Originally Posted by prudent_one
These charts would be a lot more interesting if you would add some comments to explain we're supposed to take away from the chart. Maybe I'm the only one though, and everyone else gets it.
|
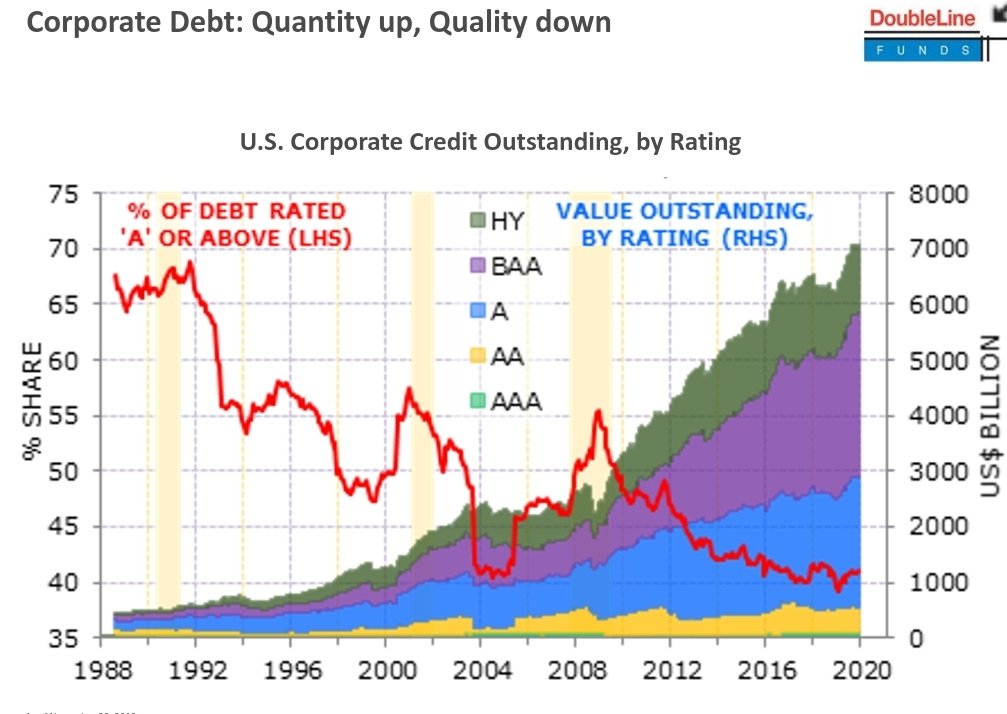
The bonds chart is showing that total quantity of lower quality bonds is increasing - while the actual financial quality of the range is in decline. The BDI is a shipping index which shows it is 78% cheaper to contract to ship something now than it was last summer, which either indicates a lack of demand for international shipping or an oversupply of freight availability. I view it as an indicator of future economic activity, but only as one piece of a bigger picture.
The most important chart is probably the amount and change in the debt holdings of the Fed.
|
|
|
|
|
01-28-2020, 05:18 AM
|
#188
|
|
Full time employment: Posting here.
Join Date: Jun 2016
Posts: 889
|
Quote:
Originally Posted by prudent_one
These charts would be a lot more interesting if you would add some comments to explain we're supposed to take away from the chart. Maybe I'm the only one though, and everyone else gets it.
|
I have always liked this thread BECAUSE THERE ARE FEW WORDS ATTACHED TO THE CHARTS.
It allows the viewer to see a picture that says a thousand words and THINK for THEMSELVES about the implications before listening to someone elses interpretation.
|
|
|
|
|
01-28-2020, 07:20 AM
|
#189
|
|
Recycles dryer sheets
Join Date: Jul 2014
Posts: 333
|
I don't disagree, but when there is NO interpretation, and my intuition about the chart is wrong, I can't learn anything.
|
|
|
|
|
01-31-2020, 09:08 PM
|
#190
|
|
Thinks s/he gets paid by the post
Join Date: Sep 2006
Posts: 2,844
|

Chart of the value of worldwide negative interest rate bonds, starting to turn up strongly again.
|
|
|
|
|
02-08-2020, 07:22 PM
|
#191
|
|
Thinks s/he gets paid by the post
Join Date: Sep 2006
Posts: 2,844
|

More employed = more 401K = higher market
|
|
|
|
|
02-24-2020, 05:16 AM
|
#192
|
|
Give me a museum and I'll fill it. (Picasso)
Give me a forum ...
Join Date: Dec 2008
Location: On a hill in the Pine Barrens
Posts: 9,720
|
Interactive global chart at SeekingAlpha:
https://seekingalpha.com/market-outl...-investing/map
Link opens to Global Performance, with other buttons at the top for GDP, Debt, Population, Unemployment, etc. Since data is shown in ranking of quintiles, its all pretty simple to understand.
Not a deep dive...
|
|
|
|
|
03-18-2020, 04:58 AM
|
#193
|
|
Thinks s/he gets paid by the post
Join Date: Sep 2006
Posts: 2,844
|

Daily moves in US bond market
|
|
|
|
|
03-18-2020, 05:12 AM
|
#194
|
|
Thinks s/he gets paid by the post
Join Date: Sep 2006
Posts: 2,844
|
If you look at one of the above charts with Corporate debt, you could see with 8 trillion of corporate debt if 50% goes bad the FED needs 4-5 Trillion of those bonds in addition to funding the 2-3 trillion national deficit for 2020. Then you take the losses corporations are going to have that will be backstopped by US government and you have another 1-2 trillion. CNBC is calling for unlimited US government loans to any business or industry. so you'd end up with 10 trillion the FED would have to buy on top of the 1.5 trillion for unclogging the "plumbing" all while revenues plummet. Fed balance sheet will be approaching 15 trillion dollars at this rate.
|
|
|
|
|
03-18-2020, 05:24 AM
|
#195
|
|
Thinks s/he gets paid by the post
Join Date: Nov 2014
Location: Austin
Posts: 1,384
|
Probably just me being an engineer, but that chart looks for the world like an audio file. I wonder what it would sound like? 
|
|
|
|
|
03-25-2020, 03:04 AM
|
#196
|
|
Full time employment: Posting here.
Join Date: Jun 2016
Posts: 889
|
Chart of the Day
|
|
|
|
|
03-25-2020, 07:24 AM
|
#197
|
|
Give me a museum and I'll fill it. (Picasso)
Give me a forum ...
Join Date: Nov 2010
Location: Sarasota, FL & Vermont
Posts: 36,371
|
yeah... but this time is different. 
__________________
If something cannot endure laughter.... it cannot endure.
Patience is the art of concealing your impatience.
Slow and steady wins the race.
Retired Jan 2012 at age 56
|

|
|
|
03-25-2020, 08:20 AM
|
#198
|
|
Thinks s/he gets paid by the post
Join Date: Aug 2013
Location: North
Posts: 4,043
|
|
|
|
|
|
04-01-2020, 07:48 PM
|
#199
|
|
Thinks s/he gets paid by the post
Join Date: Sep 2006
Posts: 2,844
|
__________________
But then what do I really know?
https://www.early-retirement.org/forums/f44/why-i-believe-we-are-about-to-embark-on-a-historic-bull-market-run-101268.html
|
|
|
|
|
04-01-2020, 07:57 PM
|
#200
|
|
Thinks s/he gets paid by the post
Join Date: Sep 2006
Posts: 2,844
|
Quote:
Originally Posted by BeachOrCity
|
The current 200 day moving average is 3,025! Let that sink in for a bear market rally potential
__________________
But then what do I really know?
https://www.early-retirement.org/forums/f44/why-i-believe-we-are-about-to-embark-on-a-historic-bull-market-run-101268.html
|
|
|
|
|
|
|
Currently Active Users Viewing This Thread: 1 (0 members and 1 guests)
|
|
|
 Posting Rules
|
You may not post new threads
You may not post replies
You may not post attachments
You may not edit your posts
HTML code is Off
|
|
|
|

 » Recent Threads
|
|
|
|
|
|
|
|
|
|
|
|
|
|
|
|
|
|
|
|
|
|
|
|
|
» Quick Links
|
|
|


 Linear Mode
