Chart of the Day

Microstrategy on way to zero

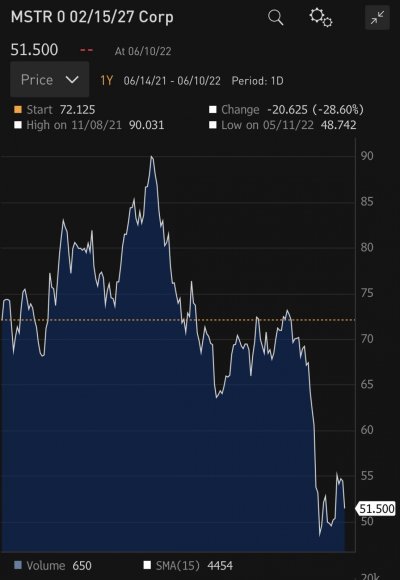
This is a 5 year zero interest bond convertible into Microstratgey stock at 1200. Problem is bitcoin is collapsing, their actual sales of software has negative comparison and had a large loss last qtr. Things are getting real in the finance world and many companies like Microstrategy were set up to take advantag of low or zero interest rates, which is the same as printing money.. With 2.4 billion in debt and 500million annual in sales @ 10% interest on their loans MSTR would exceed 50% of revenues to meet interest payment. Since the price of bitcoin has dropped 20% since it's March Qtr the loss this qtr is 1,2 billion and rising. When the value of bitcoin drops below 21K and they get margin call, they will have to go all in on all their bitcoin or sell to raise cash and pay off debt. Likelihood of total wipeout is high with this one but if you look for a turn around this bond will be better than the stock.
 

Attachments

  • FVD3IQPUEAAditU.jpg
    FVD3IQPUEAAditU.jpg
    219.1 KB · Views: 28
Last edited:
The only thing I know about MicroStrategy is that its CEO is pro Bitcoin and loaded up on it.

Today, Monday 6/13/2022, Bitcoin is down -18%, MSTR down -26%.

Bankruptcy coming?

Again, I don't know much about MSTR other than it's a software company. Why not concentrate on writing software, instead of speculating on nebulous assets? Live by the sword, die by the sword.
 
Last edited:
I just looked up some facts out of curiosity.

MicroStrategy has vowed never to sell any of the approximately 130,000 bitcoin it has in its possession...

At the end of the first quarter, MicroStrategy said the acquisition cost was $30,700 per bitcoin, net of fees and expenses...

...loans accounted for $2.4 billion of its $4 billion in bitcoin purchases...


BTC is at 23,500 at this moment. The loss is ($30700-$23500)*130000 = $936 million.
 
I just looked up some facts out of curiosity.


BTC is at 23,500 at this moment. The loss is ($30700-$23500)*130000 = $936 million.
The value at Qtr end was $34,841. What you don't know is how they carry the inventory, but any inventory purchsed above that price needed to be marked down. MSTR uses original cost basis. For calculating loss the average cost is useless, as a few low cost coins brings down the average. Using closing cost and average cost MSTR would have had no loss but had 200 million. So the change from 34,841 to 23,500 or 11K per coin means the loss must be over a billion dollars. As this is greater than the 978K of owners equity, that would mean . Wonder what their loan covenants are. After this quarter their net tangible net assets will be nearly 3 billion dollars negative. They once were in the range of companies in the 400-450 in the S&P500 like Clorox or Domino's.
 
Last edited:
I hope Running Man doesn't mind me posting a chart. I've been re-reading Michael Lewis's The big short book. In chapter 4 he mentions Eisman speaking with Ivy Zelman, at the time a housing market analyst at Credit Suisse. Zelman was discussing the ratio of median home price to income measurements. By late 2004 it had risen nationally to 4:1. As the book states:
Historically, in the Unite Sates, it ran around 3:1; by late 2004, it had risen nationally to 4:1. "All these people were saying it was nearly as high in some other countries, " says Zelman. "But the problem wasn't just that it was four to one. In Los Angeles it was ten to one and in Miami, eight-point-five to one. And then you coupled that with the buyers. They weren't real buyers. They were speculators".

The book goes on to state:
The number of For Sale signs began rising in mid-2005 and never stopped.
In the summer of 2006, the Case-Shiller index of house prices peaked, and house prices across the country began to fall".

Being curious, I decided to look up the current median price to income chart: https://www.longtermtrends.net/home-price-median-annual-income-ratio/
We are above the 2006 peak...

This article shows some city level data: https://constructioncoverage.com/research/cities-with-highest-home-price-to-income-ratios-2021
 

Attachments

  • home-price-median-income.png
    home-price-median-income.png
    90.8 KB · Views: 55
I’m going to choose not to worry about housing, since that is looking in the rear view mirror to anticipate the next recession. Banks are shored up and we haven’t heard about strippers qualifying for apartment buildings.

From where I sit, it’s helicopter money being sponged up out of the stock market and tech prices returning to earth but maybe we’ll know for sure when Michael Lewis’ writes his next book about this period.
 
Good data. It shows people never learn.

I keep reminding myself not to follow the crowd. It's harder to do than one imagines.

I would like to see a (median house * mortgage rate)/median income kind of chart. I think it would show the real pain point (or not) in terms of house payment for the typical house as a percentage of income.

Anyone know of one? I know "we" could construct one given a table of median house prices, mortgage rates and income data. But I am lazy and hope that it has already been done.

My thought is that for a while increases in housing were offset by lowered mortgage rates (and increasing incomes), but now both median price and the rate factor have been increasing much faster than median income.
 
Yea those charts match my expectations exactly for the near future. The west is due for a 30-40% drop, the south/east coast 25-35%, and the midwest 20-25%. The floor seems to be falling out at this point because all the liquidity is disappearing, the paperwork for backlogged evictions/foreclosures finally going through after the moratoriums, on top of mortgage rates shooting up at a speed only seen in the 70's (without the real income to offset that existed in the 70's, which is somewhat terrifying). While many can sit tight and not sell during a period when buyers dry up, it is inevitable that many other people will have to move due to unavoidable life events (e.g. work, family, and health).
 
Last edited:
The unknown of the pandemic caused a flight to cash, I suspect.
 
These recent charts indicate the progressing economic destruction of the middle and lower classes in this country. Thank you FED and Congress for all you have done for the working man while enriching the elite!
 
These recent charts indicate the progressing economic destruction of the middle and lower classes in this country. Thank you FED and Congress for all you have done for the working man while enriching the elite!
I do not know about that, but one must stop and think, and I know with index funds thinking is no longer necessary, what is the effect of the richest 1% of the investors going from 10 billion in cash in 2007 to 1.4 trillion by 2022, an increase of 140 X?, while simulteanously having all other assets go up more in nominal value than your cash. It implies to me tremoundous inflation potential and an explanation of why so many of the billionaires are buy large quantities of land, that financial securities have grown so high in value that the hard assets are underpriced, certainly to billionaires for their purchase. It implies a mcuh further increase I think in Real estate and any hard goods.

Put another way, in the height of 2007 with average home at 217K in the housing bubble the average cash held by the top 1% would buy 46,000 American homes.
Today with home price at 400K the cash would buy 1.3 million homes.
 
Last edited:
I do not know about that, but one must stop and think, and I know with index funds thinking is no longer necessary, what is the effect of the richest 1% of the investors going from 10 billion in cash in 2007 to 1.4 trillion by 2022, an increase of 140 X?, while simulteanously having all other assets go up more in nominal value than your cash. It implies to me tremoundous inflation potential and an explanation of why so many of the billionaires are buy large quantities of land, that financial securities have grown so high in value that the hard assets are underpriced, certainly to billionaires for their purchase. It implies a mcuh further increase I think in Real estate and any hard goods.

Put another way, in the height of 2007 with average home at 217K in the housing bubble the average cash held by the top 1% would buy 46,000 American homes.
Today with home price at 400K the cash would buy 1.3 million homes.

And that's precisely what's going on with single family homes. Firms like Blackrock scarfing up single family homes in mass to turn onto rentals since many younger folks are now priced out of the home market. North if us, a new development of several hundred homes are going up and will all be rentals.
 
These recent charts indicate the progressing economic destruction of the middle and lower classes in this country. Thank you FED and Congress for all you have done for the working man while enriching the elite!
I used to think I should work to help the cause of the middle and lower classes, but now my goal is to join the elite.
 

Attachments

  • E02EDF0D-8080-4598-9E20-335076C2243E.jpeg
    E02EDF0D-8080-4598-9E20-335076C2243E.jpeg
    69 KB · Views: 38
Bllomberg Total Bond Index last 32 years

the bloomberg bond index
 

Attachments

  • FbAfUkrWYAAC_VK.jpeg
    FbAfUkrWYAAC_VK.jpeg
    51.4 KB · Views: 58
Back
Top Bottom