Top 10 portfolio performance?

2Black

Dryer sheet wannabe
Joined
Nov 15, 2017
Messages
21
Hi,

I was wondering if anybody can give me some feedback on the following strategy
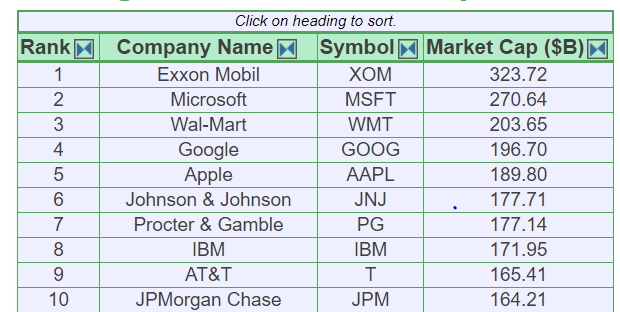
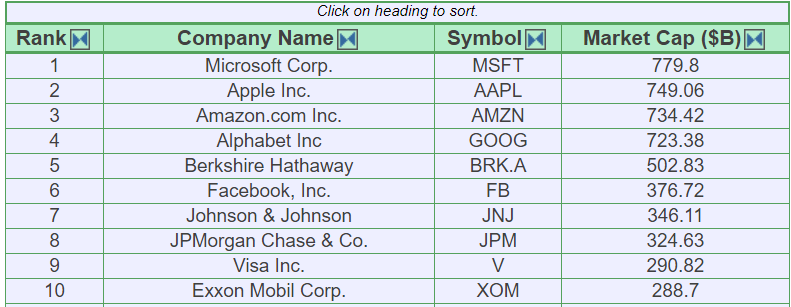
Once a year (eg early January) buy top 10 of biggest companies (market cap). and swap/redistribute once a year when needed.
So currently that would be, MSFT, AAPL, AMZN,GOOG, etc…
https://finviz.com/screener.ashx?v=121&f=cap_mega&ft=4&o=-marketcap

sure they did great last 10+ years but how did they do around 2008 or 2002? Did they bounce back, got broke or got hit more than eg. The sp500?
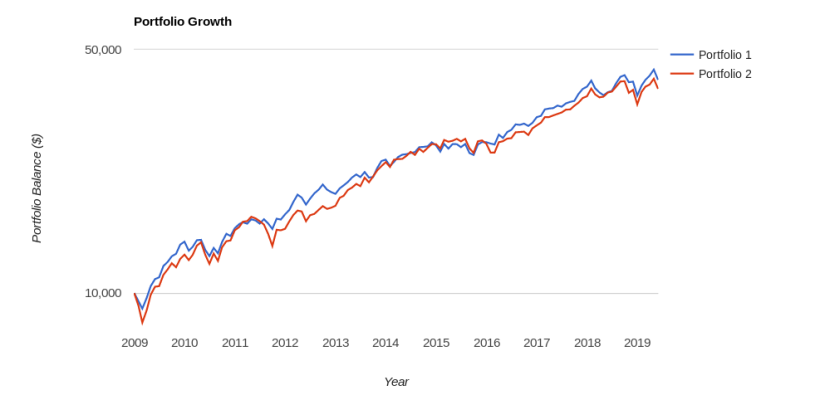
I quickly searched for historic data but couldn’t find any to run a back test.

If you simply compare the dow30 with the sp500 the result is dramatic, so if you assume the dow30 contains the biggest players of the sp500 you surely would not use that strategy but that is perhaps a bit too simple.
https://finance.yahoo.com/chart/^DJ...oYXJ0TmFtZSI6ImNoYXJ0In19fSwicmFuZ2UiOm51bGx9
anyway, I’m interested if anybody has such a portfolio (starting pre 2008) and likes to share his/hers experience
or if somebody knows where to find historic data (top 10 market cap. stocks/year)
Or would it be simpler to buy an ETF?

Thanks!
 
1. The gold standard in stock price databases is here: CRSP - The Center for Research in Security Prices |

2. If you think about it, you'll realize that anyone with an IQ above room temperature should be able to come up with a scheme that backtests well. Essentially, one just follows Will Rogers' advice: "Don't gamble; take all your savings and buy some good stock and hold it till it goes up, then sell it. If it don't go up, don't buy it."

3. If there is actually anyone running this (or any) scheme successfully, why would they tell you? Why would they tell anyone? They wouldn't, of course.

... Or would it be simpler to buy an ETF?
Of course; any total world market fund or a pair of total US market and total international market funds in your choice of proportion. It will also almost certainly be more profitable.
 
I find Portfolio Visualizer's backtester useful... with respect to your strategy, I'm guessing that the top 10 in market cap don't change all that often from year to year.

The link below compares the performance of the top 10 at Dec 2009, rebalanced annually, from Jan 2010 to May 2019... not much different than the S&P 500... actually a tad lower.

https://www.portfoliovisualizer.com...tion12_3=100&total1=100&total2=100&total3=100

When I first started reading the OP I thought the OP was heading towards a Dogs of the Dow strategy.

Top 10 by market cap as of Dec 2009 and Dec 2018
 

Attachments

  • Capture.PNG
    Capture.PNG
    32.1 KB · Views: 66
  • Capture1.PNG
    Capture1.PNG
    37.9 KB · Views: 62
thanks pb4uski,

with facebook, Berkshire, amazon, etc (the new kids) all outperforming the sp500, i guess the total result would be higher than the sp500 although it would largely depend on timing.

if anybody knows historic market cap data of these stocks, let me know, would be interesting to see if in deed it did outperform the sp500.
 
top 1 to 10
Dec-09 XOM MSFT WMT GOOG AAPL JNJ PG IBM T JPM
Dec-10 XOM AAPL MSFT BRK-A GE WMT GOOG CVX IBM PG
Dec-11 XOM AAPL MSFT IBM CVX GOOG WMT BRK-A GE PG
Dec-12 AAPL XOM GOOG WMT MSFT BRK-A GE IBM CVX JNJ
Dec-13 AAPL XOM GOOG MSFT BRK-A GE JNJ WMT CVX WFC
Nov-14 AAPL MSFT XOM GOOG BRK-A JNJ WMT WFC GE PG
Dec-15 AAPL GOOG MSFT BRK-A XOM AMZN FB GE JNJ WFC
Dec-16 AAPL GOOG MSFT BRK-A XOM AMZN FB JNJ JPM GE
Dec-17 AAPL GOOG MSFT AMZN FB BRK.B JNJ JPM XOM BAC
Dec-18 MSFT AAPL AMZN GOOG BRK.A FB JNJ JPM V XOM
 
2Black:
There's a guy, Dale Roberts, on Seeking Alpha who has posted several articles regarding skimming the top ten (or whatever) holdings from ETF's. I don't recall if he has done the research that you are interested in, but, he does offer up some amount of research on skimming.
 
here the results for only the top 4 (easier to do since they don't change)
compared to sp500
invest $100,000 in 4 stocks or spy only
period: buy 4th jan 2010, till now (so from dec. 2009 data)
spy %/yr (ir.schema) -> 12.6%
top4 %/yr(ir.schema) -> 18.4%

chart4.png
 
here the results for only the top 4 (easier to do since they don't change)
compared to sp500
invest $100,000 in 4 stocks or spy only
period: buy 4th jan 2010, till now (so from dec. 2009 data)
spy %/yr (ir.schema) -> 12.6%
top4 %/yr(ir.schema) -> 18.4%
...

Wait a minute. Were those stocks picked on info available on 4th jan 2010, or are they the top stocks now?

It is far too easy to pick (yet, impossible to buy, w/o a functioning time machine) the stocks that did well since 2010.

And even if this was a 2010 information based pick, how did it do in 2009, 2008, 2005, 2000, 1999, 1992, 1984, 1966, etc?

Even a broken clock is right twice a day.

-ERD50
 
top 1 to 10
Dec-09 XOM MSFT WMT GOOG AAPL JNJ PG IBM T JPM
Dec-10 XOM AAPL MSFT BRK-A GE WMT GOOG CVX IBM PG
Dec-11 XOM AAPL MSFT IBM CVX GOOG WMT BRK-A GE PG
Dec-12 AAPL XOM GOOG WMT MSFT BRK-A GE IBM CVX JNJ
Dec-13 AAPL XOM GOOG MSFT BRK-A GE JNJ WMT CVX WFC
Nov-14 AAPL MSFT XOM GOOG BRK-A JNJ WMT WFC GE PG
Dec-15 AAPL GOOG MSFT BRK-A XOM AMZN FB GE JNJ WFC
Dec-16 AAPL GOOG MSFT BRK-A XOM AMZN FB JNJ JPM GE
Dec-17 AAPL GOOG MSFT AMZN FB BRK.B JNJ JPM XOM BAC
Dec-18 MSFT AAPL AMZN GOOG BRK.A FB JNJ JPM V XOM

here the results for only the top 4 (easier to do since they don't change)
compared to sp500
invest $100,000 in 4 stocks or spy only
period: buy 4th jan 2010, till now (so from dec. 2009 data)
spy %/yr (ir.schema) -> 12.6%
top4 %/yr(ir.schema) -> 18.4%

chart4.png


Well, when I plug your top 10 into portfolio analyzer, it shows a very small lead for the 10, but the lead changes hands over time, so no clear winner. Might be different next month.

No way am I going to give up the power of diversification for such an unsure potential advantage.

http://bit.ly/2WMD5ts << short link to portfolio analyzer.

-ERD50
 
And here's a screen shot. The top 10 is p1, slightly ahead of VTI:

-ERD50
 

Attachments

  • Screenshot from 2019-06-16 19-56-50_VTI versus 2009 top 10.png
    Screenshot from 2019-06-16 19-56-50_VTI versus 2009 top 10.png
    31.7 KB · Views: 42
Regarding the top 4, for 2010, dec 2009 info was used, for 2011 dec 2010, etc.
When you use the top 10, you get 12.77% so slightly ahead of sp500 with 12.6%/yr
I guess the issue is that stocks moving up in the list (gaining market cap) are the good ones, but the total results is compensated by the ones going down in the list (loosing market cap)
For those top 4, it worked out well for 2010-2018 since they didn’t change, if there is change in the top 4, I’m sure performance will go down quick.
Perhaps a scenario were you buy newcomers and dump the ones as soon as they go down (1 or more positions) in the list. But that gets rather complex, you may end up with little stocks.
So I agree not worth the trouble.

if you look at the relative risers of the top 50, going up in the top 50 over the past years and now in the 10-20 range, you should buy V, MA, CSCO and DIS
 
Last edited:
But... market cap can increase for reasons other than an increase in stock price. For example, additional shares issued as the result of a merger or acquisition paid for my shares rather than cash... and since many acquisitions ultimately destroy value that might not be a good sign.
 
Well, when I plug your top 10 into portfolio analyzer, it shows a very small lead for the 10, but the lead changes hands over time, so no clear winner. Might be different next month.

No way am I going to give up the power of diversification for such an unsure potential advantage.

http://bit.ly/2WMD5ts << short link to portfolio analyzer.

-ERD50

+1
 
And here's a screen shot. The top 10 is p1, slightly ahead of VTI:

-ERD50
I believe you did not adjust for market cap, had you done so, I think the top 10 performance improves. In other words right now MSFT is 3.3 times the weighting of the #10 stock Exxon Mobil, so you should own 3.3 times as much
 
I believe you did not adjust for market cap, had you done so, I think the top 10 performance improves. In other words right now MSFT is 3.3 times the weighting of the #10 stock Exxon Mobil, so you should own 3.3 times as much

OK. But that leads to even higher levels of stock specific risk. I'll pass.

-ERD50
 
I find Portfolio Visualizer's backtester useful... with respect to your strategy, I'm guessing that the top 10 in market cap don't change all that often from year to year.

The link below compares the performance of the top 10 at Dec 2009, rebalanced annually, from Jan 2010 to May 2019... not much different than the S&P 500... actually a tad lower.

https://www.portfoliovisualizer.com...tion12_3=100&total1=100&total2=100&total3=100

When I first started reading the OP I thought the OP was heading towards a Dogs of the Dow strategy.

Top 10 by market cap as of Dec 2009 and Dec 2018

Thanks for reminding me how I lost money on XOM ;)

I thought this looked a little like Dog o Dow as well... I've since widened my thinking that indeed, owning 3000 equities via a few ETFs serves my pockets better than me trying to pick 10 *WINNING big Mega Caps.

Just let the robots re-balance.
 
Thanks for reminding me how I lost money on XOM ;)

I thought this looked a little like Dog o Dow as well... I've since widened my thinking that indeed, owning 3000 equities via a few ETFs serves my pockets better than me trying to pick 10 *WINNING big Mega Caps.

Just let the robots re-balance.

First off, just using the average of the top 10 market caps gives almost perfect correlation to VTI over the last 10 years. Secondly, unlike fake index backtesting to 1926 the market capitalization of top individual stocks actually existed and could be tested to see how it behaved.

All I have read in the past 2 years in defense of passive indexing is: Show me a system that works and a means to implement and I’ll implement it, I think this thread pretty much puts the truth out there is no real seeking of such an investment.
 
....

All I have read in the past 2 years in defense of passive indexing is: Show me a system that works and a means to implement and I’ll implement it, I think this thread pretty much puts the truth out there is no real seeking of such an investment.

Can you expand on that? I'm not sure I understand exactly what the rules are, or where this data is that goes back over many decades, so we can see performance under differing market conditions. Was it posted and I missed it?

Seems a little early in the thread for you to declare "success" and that we are closed minded.

-ERD50
 
Last edited:
Can you expand on that? I'm not sure I understand exactly what the rules are, or where this data is that goes back over many decades, so we can see performance under differing market conditions. Was it posted and I missed it?

Seems a little early in the thread for you to declare "success" and that we are closed minded.

-ERD50
@ERD50, this is typical @Running_Man: First, vague assertions that the success of passive investing is somehow faked or the result of a plot, despite 50 years of hard data beginning with Michael Jensen's PhD thesis published in 1967. Then an assertion that some other scheme is superior, unsupported by any data.

Really there's no point in trying to debate when he bases his arguments on his own unproven "facts."
 
Can you expand on that? I'm not sure I understand exactly what the rules are, or where this data is that goes back over many decades, so we can see performance under differing market conditions. Was it posted and I missed it?

Seems a little early in the thread for you to declare "success" and that we are closed minded.

-ERD50

You have stated extensively in the past on many individual stock thread, that if a study was shown where individual investing could be "proved" with long term data, you would consider it. And actually of all the posters in the forum that advocate for passive investing as the only way, you are probably the most willing to look at data. Yet the first comments on the original posting was to assure that it was not possible to beat passive investing, not by you but by OLD Shooter and a couple others. When a quick study was done by members of the board, NO ONE commented "wait, that's interesting I would have to see more data" but "NO".

The first thing that hit me was the amazing correlation to VTI of the top 10 stocks, and the over performance of the Top 4. Perhaps somewhere that has been commented on before but I have not heard of it before. The interesting thing to me of buying the most capitalized stocks is that it plays on index & passive investors, they are buying more of these stocks than any other stock for no reason other than they are the biggest cap names. As a matter of fact these top 10 stocks get about 20% of all major market investments. And the data is going to be available to easily back test this thesis. That testing may prove it wrong, may prove it right. I certainly am not convinced one way or another at this point, but certainly I would be willing to entertain the thought and be willing to consider and actually believe it may be possible that this actually over performs. After all --- any investment thesis in this group of stocks is possible, as cheap as indexing, the market is huge and hedging of risks in the investments is easily obtained.

I would like to see if there is more to this than meets the eye. There are advantages that large companies have over small cap companies, for instance ability to manipulate and lower income taxes similar to what retirees do, (can buy losing companies for the tax break to pay for acquisitions) that may mean this is actually an inherent part of market valuation.

Old Shooter is an advocate for one style. This is the forum for debating of investing ideas. Commenting the same hypothesis in thread after thread on INDIVIDUAL STOCK THREADS will get push back from me if you refuse to look at data.
 
... When a quick study was done by members of the board, NO ONE commented "wait, that's interesting I would have to see more data" but "NO". ....

Well, correlation of the largest cap stocks with the total market over 10 years is just not that surprising to me. It's the old "Pareto Principle" (hey, how come the 'Pareto is my pal' mnemonic doesn't work here? ;) )

I guess I missed it, was there something posted that showed this had some significant performance advantage over the total market? So with all due respect, I don't think that's enough to make too many people jump up and say "Show me more!".

... And the data is going to be available to easily back test this thesis. That testing may prove it wrong, may prove it right. I certainly am not convinced one way or another at this point, but certainly I would be willing to entertain the thought and be willing to consider and actually believe it may be possible that this actually over performs. After all --- any investment thesis in this group of stocks is possible, as cheap as indexing, the market is huge and hedging of risks in the investments is easily obtained.

I would like to see if there is more to this than meets the eye. ...

As would I. So take a shot at it. And/or publish the rules - maybe we can agree to slit the task up and share the load by analyzing different decades and putting it all together? But don't be dismayed that the (justifiably, IMO) skeptical here aren't feeling like it's another wild goose chase of data-mining. As Carl Sagan said, extraordinary claims require extraordinary evidence. I won't go that far, but it does take more than an observation about 10 years of data.

... This is the forum for debating of investing ideas. Commenting the same hypothesis in thread after thread on INDIVIDUAL STOCK THREADS will get push back from me if you refuse to look at data.

That's fine. Where is this data? And what are the rules? Buy the 4 largest market cap on Jan 1 each year? In proportion? Taxes?

-ERD50
 
Last edited:
... Old Shooter is an advocate for one style. This is the forum for debating of investing ideas. Commenting the same hypothesis in thread after thread on INDIVIDUAL STOCK THREADS will get push back from me if you refuse to look at data.
I'm as greedy as the next person, but I was trained as a scientist and and engineer. Anecdotes and arm-waving don't do it for me. Give me data (not backtesting) that shows another investing method has consistently beaten passive and I'm in with $100K for the experiment.

While your'e at it, please also explain specifically what you are talking about when you say "fake index backtesting to 1926."
 
Back
Top Bottom