The national debt, GDP, and politics

IndependentlyPoor

Thinks s/he gets paid by the post
Joined
Jul 1, 2009
Messages
1,142
Location
Austin
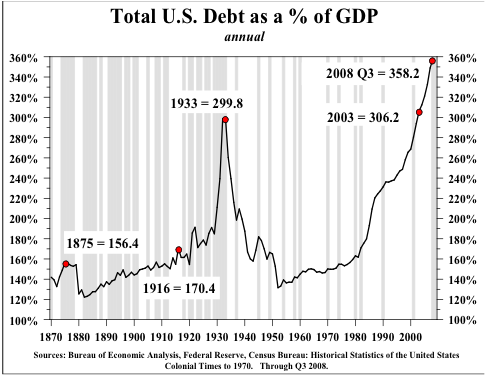
I suspect that we all worry about the national debt. It is easy to imagine it ruining our retirement plans. It is also very satisfying to blame it on the "other side". This chart, via one of my favs, Barry Ritholtz, sheds some interesting data on the argument.
federal-debt-to-gdp-politics-update.gif
 
I'm not sure how you interpret that chart. I see this. Up until about 1980, Americans generally thought that the federal gov't should collect enough in taxes to pay for it's spending. They weren't really pure about this, but there were enough voters with this opinion to give the politicians some backbone.

After that, more voters believed that this didn't matter. One rather quick change was the belief that cutting taxes actually raised gov't revenue (a pleasant fantasy). Other longer term trends probably involved the replacement of the Depression generation with the post war generation, and a selective reading of Keynes (only the part about deficits having some value). At at any rate, politicians looked at Mondale and GH Bush and decided that raising taxes was death. Of course, nobody made any serious proposals to cut any spending that benefits the middle class, either.

Unfortunately, I don't see this changing.
 
Your graph isn't scary enough. When you look at all of the debt including personal as well as state and local then you get a graph that should scare the bejeevers out of anyone...

total-us-debt-vs-gdp.png


This doesn't include the unfunded liabilities either. Many have wondered if we have the capacity to repay.
 
Isn't this one of the main reasons the markets are spooked? Riots in Greece coming to a neighborhood near you soon!
 
Your graph isn't scary enough. When you look at all of the debt including personal as well as state and local then you get a graph that should scare the bejeevers out of anyone...

total-us-debt-vs-gdp.png


This doesn't include the unfunded liabilities either. Many have wondered if we have the capacity to repay.

OFGS
I borrow money to buy land. The land was always there. The debt shows up in your chart but nothing changed with regard to the land . You can't compare debt to GDP

You compare debt to assets.
 
Your graph isn't scary enough. When you look at all of the debt including personal as well as state and local then you get a graph that should scare the bejeevers out of anyone...

total-us-debt-vs-gdp.png


This doesn't include the unfunded liabilities either. Many have wondered if we have the capacity to repay.
It's kind of interesting that the slope of the line really goes crazy in modern times starting in 1980 aka the birth of supply side economics. There was a slight shift to the right in the early 90's but the same slope as the early 80's resumed in 2000. I don't understand this at all. If I didn't know better I would have to say based on that chart that all of the so called "prosperity" of the last 30 years is based on borrowed money ... I though it was due to unleashing the creative powers of tax reduction and reduced regulation.
 
The national debt, GDP, and politics
You forgot to include sex, religion, SWR, and whether or not to pay off the mortgage...
 
Well. It seems that everyone is talking about it. We see what is happening in the EU (other mature developing nations) so I suspect we will can expect some changes in the coming years.

But there is no easy way to get past the Baby Boom bubble... it is a numbers thing!

I suspect the following will occur over the next few years in bits an pieces to attack the problem:


  • Reevaluation of spending with reductions or program elimination (in areas considered non-essential... and there are many)
  • Tougher negotiation on Govt contracts to reduce waste and cost in general.
  • More focus on Fraud
  • Higher taxes for all (no way around it considering SS and Medical spending)
  • Likely... increased legal immigration to deal with worker shortages that can affect business (and also causes less tax [-]revenue[/-] for the govt). We either bring workers in or ship the work overseas. I would prefer to keep the industry here.
 
OFGS
I borrow money to buy land. The land was always there. The debt shows up in your chart but nothing changed with regard to the land . You can't compare debt to GDP

You compare debt to assets.


I would say debt to assets is important, but you can not ignore debt to GDP...

Using your example, you now have to divert income to pay off the debt... that can not be used to increase GDP... as a one off, it does not matter much... but if everybody did it, the economy would suffer...

We might have a real estate bubble and when it pops people can not pay their debt etc. etc. (just threw this in for fun)..

I do this exercise in my class. Product liability that causes injury imposes true costs on society, but paying the injured person is a transfer payment within the society so it costs society nothing (setting aside administrative costs) If we allow people to be injured we save nothing by refusing to pay them. In the same way any debt service is paid to someone else in the society. Balance of payments can be very relevant, and net external debt, but none of that is captured in your graph.
 
Here I am, bumping my own thread again. Sorry. Thought these charts interesting.
SIGChart3.jpg

Note:
*For the US, figures include public holdings of Treasuries, but not Fannie Mae or Freddie Mac (about $8.1 trillion year end 2009, per BIS), or the “intragovernmental holdings” of Social Security, Medicare, the Civil Service Retirement Fund, etc. (about $4.5 trillion year end 2009, per US Bureau of Public Debt).
SIGChart5.jpg

The provenance isn't the best. Calculated Risk posting data from "some investor guy".
 
Back
Top Bottom