COVID mortality dynamics NHS study

Status
Not open for further replies.
Interesting although I am again surprised at how slow information like this is getting out. In theory, with computerized records these statistics should be available almost instantly. This analysis is based on 5,700 deaths in the UK and states that it is up to 25 April. The UK now has 32,000 deaths.

Nothing too shocking in my mind. Striking how dramatically age is the most important risk factor with very few deaths in those under 50. Also, that the hazard ratios for most other 'risk factors' is not that marked and some, such as hypertension, barely register. Will be interesting to compare with other population based studies.

Thanks for posting.
 
Did they say data shows smoking decreases risk? Lol.

Also, does it say almost 6mm people 18-40 have got the disease, and only 40 of them have died? More than 40 of them could have died from drunk drinking or something over the same time. Huh.
 
Interesting although I am again surprised at how slow information like this is getting out. In theory, with computerized records these statistics should be available almost instantly.
It's one of those things that make you go "Hmmm....?"
 
Good stuff, once again it shows how low the risk of death is for anyone under 55, just as CDC data has shown. Only 2.4% of all deaths are less than 50 years old, which undoubtedly includes some less than 50 yo who are overweight or not optimally healthy. Only 6.2% of deaths were between 50 to 59 yo. That also suggests serious cases are also much lower risk for anyone under 55, and once again points to a “vulnerable” population that needs significantly different consideration from all of us.

And deaths were 0.03% of the total population. 0.26% of those 80 yo and above.

But your “not predictive” statement is well taken. I’ve thought I knew something about SARS-CoV-2 several times in the past few months, only to find out new info that changes what I thought I’d learned...
 

Attachments

  • DC4CB186-56C0-46D1-B4A2-61AC63C2C33F.jpeg
    DC4CB186-56C0-46D1-B4A2-61AC63C2C33F.jpeg
    476.9 KB · Views: 44
Last edited:
Thanks for posting the link. It is interesting to finally see a detailed breakdown of buzzword "underlying conditions".
 
Hospital deaths, so the UK wasn't even counting deaths in care homes or at home from COVID for a long time. So the stats for that aren't accuratel..in fact NYC keeps adjusting their numbers up due to uncounted deaths in nursing homes and at home.
 
This is log scale horizontally, so a little to the right makes a lot of difference. I'll give the authors credit for knowing thats the 'best' way to show it.


Being a normal weight male looks similar risk to being a "large" female. Yeah, and smoking is protective, hehe!


What we might consider reminding ourselves of is that these are people who "entered the system", so countless thousands, with and without comorbidities, who had less severe cases, or simply stayed home and lived through it, are not accounted for.
 

Attachments

  • Screenshot_20200511-082820.jpg
    Screenshot_20200511-082820.jpg
    147.3 KB · Views: 38
  • Screenshot_20200511-082832.jpg
    Screenshot_20200511-082832.jpg
    172.5 KB · Views: 37
  • Screenshot_20200511-082857.jpg
    Screenshot_20200511-082857.jpg
    147.7 KB · Views: 33
Thanks. It's a PITA skimming through the data but the range charts are easy to grasp at a glance.
 
Last edited:
Hospital deaths, so the UK wasn't even counting deaths in care homes or at home from COVID for a long time. So the stats for that aren't accuratel..in fact NYC keeps adjusting their numbers up due to uncounted deaths in nursing homes and at home.

The study paper says only hospital deaths because they were all tested positive for Covid. The UK reported deaths now are for all settings, with care homes being the largest number, but not all deaths outside hospital are tested for Covid. With 150,000+ care homes, all run by local councils or in private ownership, non under the control of the NHS, it took quite a while to speed up the collection of the reported deaths and synchronize them with hospital deaths. For the last 7 to 10 days the UK has been reporting all deaths from Covid as a single number instead of 2 figures, the non-hospital deaths lagging a week behind the other.
 
The study paper says only hospital deaths because they were all tested positive for Covid. The UK reported deaths now are for all settings, with care homes being the largest number, but not all deaths outside hospital are tested for Covid. With 150,000+ care homes, all run by local councils or in private ownership, non under the control of the NHS, it took quite a while to speed up the collection of the reported deaths and synchronize them with hospital deaths. For the last 7 to 10 days the UK has been reporting all deaths from Covid as a single number instead of 2 figures, the non-hospital deaths lagging a week behind the other.

That's happening here in places like New York, one day NY reported a backlog of past care homes deaths that was well into the hundreds...they don't go back and update the day someone actually died.
 
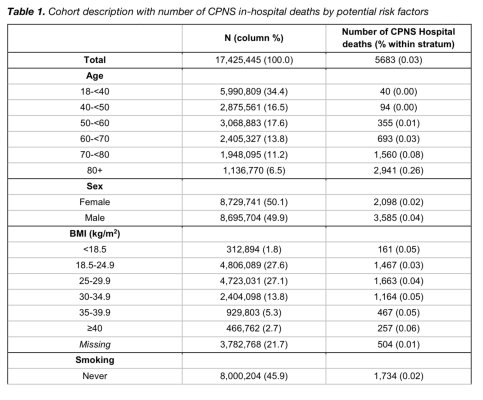
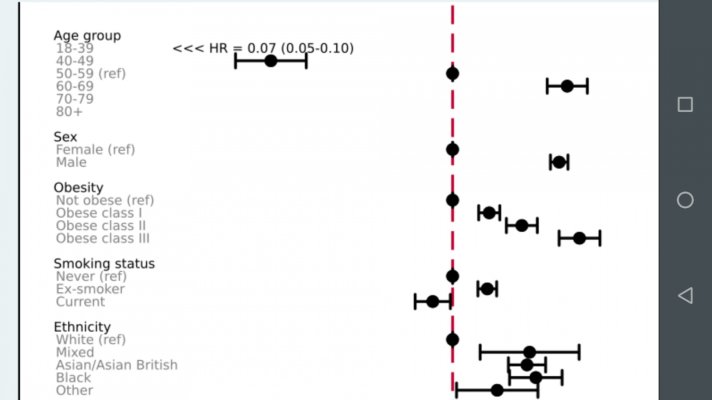
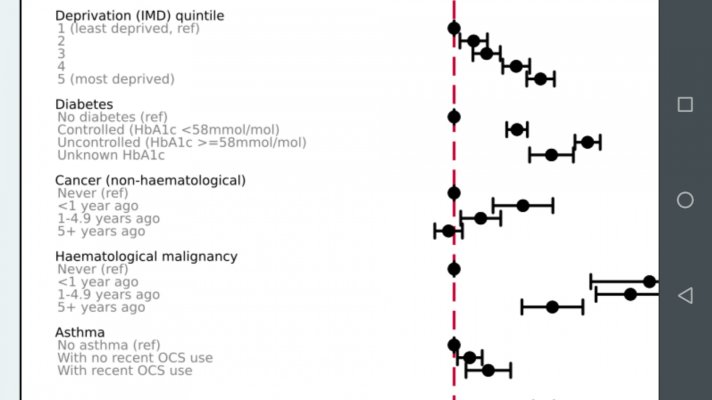
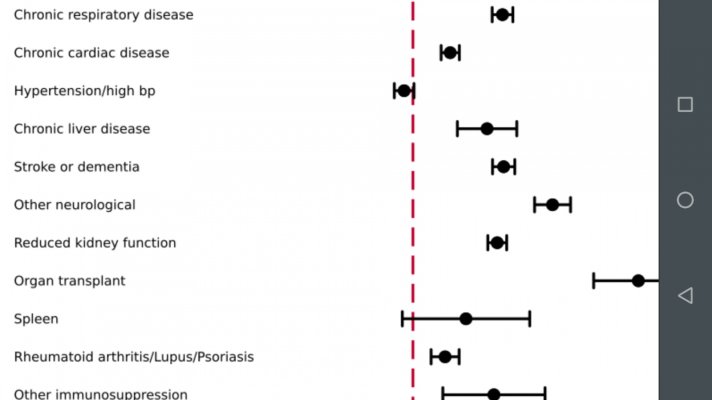
Here’s an interesting look at England NHS data of COVID casualties, with classifications by demographics and pre-existing conditions. It’s not predictive, it’s just a detailed statistical breakdown by age, gender, race and specific pre-existing condition.

https://www.medrxiv.org/content/10.1101/2020.05.06.20092999v1.full.pdf
Interesting data...thanks for sharing. I am curious as to why you would say it isn't "predictive." Seems like 17MM observations is a huge sample size that would be statistically significant in predicting future outcomes.
 
Status
Not open for further replies.
Back
Top Bottom