Welcome, James!
I spent a fair amount of time with it this morning, after my note above. I must say I am very impressed with your effort. It is very thorough and very professional. It allows investigating a lot of parameter space very quickly.
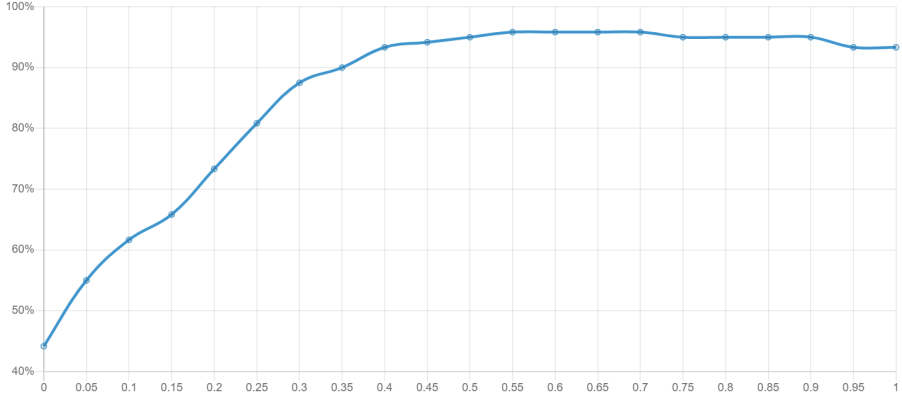
One question: I assume that the graphs represent a (smoothed) histogram of, say, ending portfolio values. Is that correct?
You label the peak of that distribution "the median." If I am correct about what the graph means, then I don't think that is the median. That would be "the mode," right?
Thanks a ton for the kind words.
Under-the-hood, I am using p-quantiles for the data displayed in the charts. The p values used are 0, 0.05, 0.25, 0.5, 0.75, 0.95, and 1. What this means is that the value at the "peak" of the graph
is actually the median: half of the end portfolio values appear above that value, and the other half appear below it.
I understand how it may seem to represent the mode, though, because it is not always the case that the median would be at the peak of a probability distribution graph. This is an artifact of how I am rendering the charts right now, which is still just a "first pass" at visualizing the data. I have it hard-coded to always render the peak at the median, and every chart gets the same curve (adjusted for where the other p-quartile values land). It's been on my to-do list to do a second pass to make this more geometrically meaningful.
Because of your comment I'm going to move that on up in my to-do list, so keep an eye out for v2 of the charts! Thanks so much for asking about this!
Like most Monte Carlo calculators. No provision for investment real estate other than putting in anticipated net income and the property asset but RE growth rarely comes close to equities growth. Although rental return plus growth can... not too impressed.
This isn't a Monte Carlo calculator, although it is pretty similar. It's more accurate to say that it's a backtesting calculator that uses historical data for its calculations (as an aside, an update to introduce a Monte Carlo mode is in the works!)
One of the ways that you can support real estate right now is through Additional Income. There's a guide explaining how that works here:
https://ficalc.app/configuration/additional-income/
This may not be enough, though...if that's the case, I'm always open to hearing suggestions on how this could be made more robust.
One of the challenges with real estate is that there is no historical data for all real estate in every geographic location in the U.S. dating as far back as the stocks and bonds data goes (1871). And it makes things a bit muddy when you start merging real data with "fake" data. It's similar to the difference between running a calculation assuming 10% yearly stocks growth vs. using actual historical data. Even though it may average out to be the same, it's the details of how it reaches that average that are often where interesting insights come from.
Anyway, feel free to drop suggestions if you have any. I'd love to add a super robust real estate solution into the calculator!
Hi jamesplease,
Can you give us a biography, please? Maybe put it here:
https://www.early-retirement.org/forums/f26/
Thanks!
I'd love to, but before I do, I'd like to know it you still think I should if:
- I don't make my personal FI numbers public
- I'd like to do something more substantial than a self-promo post that just says, "Hi all, I swung by because my app was being discussed here!"
Do you still think it's worth posting a bio there? I'd be happy to if you do!
Thanks, that is better. The default motion is annoying.
I'm glad the setting worked for you! Just let me know if anything else is annoying or if you have any other thoughts and suggestions. I love hearing what people think of the calculator!