David1961
Thinks s/he gets paid by the post
- Joined
- Jul 26, 2007
- Messages
- 1,085
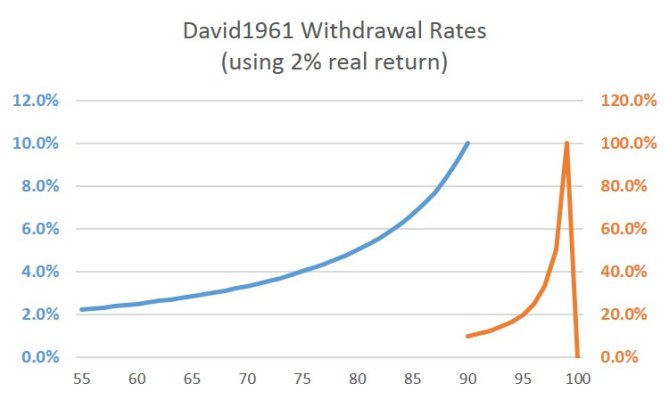
I love playing around with numbers and whenever I calculate my portfolio value, there is one "metric" that I always want to calculate. I think I either read it in a book or article or on this forum, but not sure. Maybe I dreamed it up somewhere along the line. The metric is dividing my portfolio value by 100 minus my age. My interpretation of this metric is it is the amount I can withdrawal each year (and increase with inflation each subsequent year) if my investments exactly keep up with inflation and I live to be 100. Does anyone remember reading about this anywhere? For some reason, I always want to calculate it, even though I'm not sure how meaningful it is. Maybe the number is a very safe withdrawal yearly amount?