Qtrly Volatility for an actual 60:40 AA

Midpack

Give me a museum and I'll fill it. (Picasso) Give me a forum ...
Joined
Jan 21, 2008
Messages
21,319
Location
NC
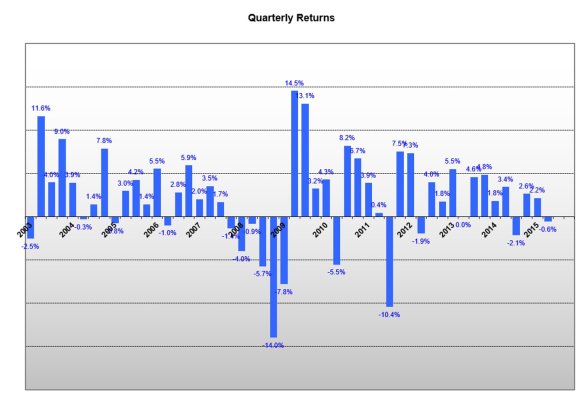
For those who like numbers/picture as much as words, here are the actual quarterly returns for

  • the past 11-12 years for a 60:40 AA,
  • rebalanced using the 25/5 rule,
  • with essentially no timing/trading (tweaked asset classes a few times, but never panic bought/sold anything).
I won't say I enjoyed waiting for the 2008-09 meltdown market bottom, but I slept fine through it all. Just another data point for those wondering about risk tolerance. YMMV

Note: It's been shown here many times that the historical difference in success rates between 40:60 and 60:40 are slight. Presumably less volatile with little effect on success FWIW.
 

Attachments

  • Quarterly Returns.jpg
    Quarterly Returns.jpg
    144.4 KB · Views: 93
Looks like market is due for major correction based purely on the visuals presented here


Sent from my iPhone using Early Retirement Forum
 
Note: It's been shown here many times that the historical difference in success rates between 40:60 and 60:40 are slight. Presumably less volatile with little effect on success FWIW.

I keep reading that here. If so, why does one bother leaning one way or the other?

Why not split it down the middle at 50/50 and let it go? I know a lot of folks here do that, but more curious about those who move more in either direction if it falls into the "it doesn't really mater" category
 
I keep reading that here. If so, why does one bother leaning one way or the other?

People might want to optimize for metrics other than just success rate. Like volatility or average ending balance. While 30 year success rate might not change much, there can be bigger differences on these other criteria.
 
People might want to optimize for metrics other than just success rate. Like volatility or average ending balance. While 30 year success rate might not change much, there can be bigger differences on these other criteria.

Good point. Thanks.
 
Midpack, I'm impressed that you kept it at 60/40 for so long a time.

This is about the same timespan I've been retired (since Apr 2003). During that time our portfolio varied from a beginning 74/26, to 57/43 at the start of the 2008 decline, to 46/54 at the market low in 2009, to the current 55/45 with plenty of tinkering from me along the way. I'm always looking for a way to game the system :facepalm:.
 
I keep reading that here. If so, why does one bother leaning one way or the other?

Why not split it down the middle at 50/50 and let it go? I know a lot of folks here do that, but more curious about those who move more in either direction if it falls into the "it doesn't really mater" category

One thing that concerns me about going as low as 40/60 is that is near the inflection point where FIRECalc starts showing reduced success rates. Assuming the future rhymes with the past instead of duplicating it, I can't help thinking it might be safer to be near the midpoint of that chart (~ 60/40 - 70/30)?

-ERD50
 
Back
Top Bottom