SWR article in Barron's

donheff

Give me a museum and I'll fill it. (Picasso) Give me a forum ...
Joined
Feb 20, 2006
Messages
11,331
Location
Washington, DC
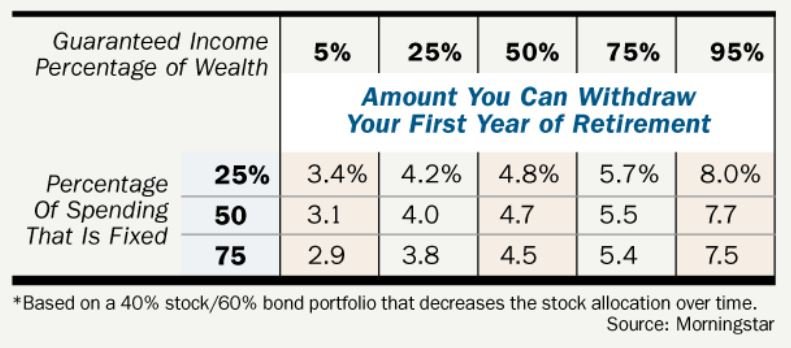
This is an interesting article in Barron's cautioning retirees about the 4% rule. It starts out pretty alarmist, saying this is the worse time to retire since before the dot com bubble. But despite the bleak intro the article then covers the standard ground of Wade Pfau, Guyton, et al in a manner familiar to most of us here. I found the Morningstar chart below that purports to set out conservative initial SWR percentages pretty reassuring given the bleak intro.
 

Attachments

  • SWRChart.JPG
    SWRChart.JPG
    55.5 KB · Views: 176
Thank you. I do find these sorts of charts and tables reassuring.
 
Interesting chart. It might be even a little more conservative than it appears, as it is based on a 40/60 AA with a decreasing stock glidepath.
 
A lot of fear-mongering and scare tactics in that article. So Wade Pfau says the 4% result from the Trinity Study only works two thirds of the time, even though the study said it worked 95% of the time. The basis for the discrepancy isn't given. A bunch of other hand waving, without presenting the analytical basis of the numbers.


Maybe I'm misinterpreting what was presented.
 
People who post here know that this comparison is just wrong.

What’s more, every year (until you turn 70) that you delay claiming your benefits, the amount you’re entitled to grows 8%. That’s a far better return than you’ll likely get on stocks,
 
The chart in the OP is for people "comfortable with fluctuations in annual income".

Unfortunately, the Barron's article does not say how much fluctuation you need to be comfortable with.

Do I need to be comfortable with a 50% drop? or a 10% drop?

The article did not provide a link to the Morningstar source.
 
People who post here know that this comparison is just wrong.
That's a good point. We discuss the issue ad naseum so most regular readers know the factors that matter. But lots of articles take the amount of difference at 70 vs FRA and treat that as if it's a percentage growth in the ROI completely neglecting the actuarial neutrality due to differing expected terms.
 
A lot of fear-mongering and scare tactics in that article. So Wade Pfau says the 4% result from the Trinity Study only works two thirds of the time, even though the study said it worked 95% of the time. The basis for the discrepancy isn't given. A bunch of other hand waving, without presenting the analytical basis of the numbers.


Maybe I'm misinterpreting what was presented.

Not sure but I think Pfau in general seems to always refer to each stock market on a global basis vs. just the US stock market.
 
People who post here know that this comparison is just wrong.

They are likely comparing to recent projected stock returns for the next ten years, which have been in the 5% nominal range. Just remember, "nobody knows nuthin".

It is interesting how they use the base expenses and guaranteed income % to determine the withdrawal rate. It makes it a little more customized to each situation.

VW
 
I've tried to find the article by MorningStar's David Blanchett that is the basis for the chart in the OP, but could not pinpoint it. I did see some related articles, but without that particular chart or data leading to that chart. Now after about 2-3 visits to the website, when I click the Barron's link, I'm locked out, unless I subscribe. I can clear cache and get back in (I think), but if anyone finds/has the article or a link, please post it. It will be greatly appreciated.
 
They are likely comparing to recent projected stock returns for the next ten years, which have been in the 5% nominal range. Just remember, "nobody knows nuthin".

It is interesting how they use the base expenses and guaranteed income % to determine the withdrawal rate. It makes it a little more customized to each situation.

VW
I suppose that's possible. I think their wording suggests something else.

If you are right, they should have said "Deferring SS provides a better return than the 5% nominal return (3% real return) we're expecting on stocks over the next couple decades."
 
Good article. Thanks for posting.


The table is very conservative. Read the fine print. 40/60 with decreasing equity allocation over time. Interestingly, the article cites Kitces who advises an increase in equity allocation with age.
 
I just wanted to link the best set of articles on SWR that I've ever read on the internet even if I have linked them before:

ERN's Ultimate Guide to Safe Withdrawal Rates

This set of articles covers everything that I ever wanted to know and needed to know with critiques of all the other articles that you might want to read or have already read. And by "critiques" I mean that the good things and bad things are discussed.

Lots of food for thought in this set of articles.

I just started looking at these. They look good to me, but they it will probably take me a while!:greetings10:
 
Good article. Thanks for posting.


The table is very conservative. Read the fine print. 40/60 with decreasing equity allocation over time. Interestingly, the article cites Kitces who advises an increase in equity allocation with age.
I'm not sure what "conservative" means in this case. The table is for people who have spending flexibility. But, it doesn't specify how much. A simple "percent of current balance" withdrawal strategy will last forever, if you have enough flexibility to take the downside.
 
I'm not sure what "conservative" means in this case. The table is for people who have spending flexibility. But, it doesn't specify how much. A simple "percent of current balance" withdrawal strategy will last forever, if you have enough flexibility to take the downside.

I mentioned the conservative reference also and for me I meant that most folks probably don't follow a 40/60 AA with a decreasing equity glide ratio aka most folks on this forum use a higher equity %.
 
I just wanted to link the best set of articles on SWR that I've ever read on the internet even if I have linked them before:

ERN's Ultimate Guide to Safe Withdrawal Rates

This set of articles covers everything that I ever wanted to know and needed to know with critiques of all the other articles that you might want to read or have already read. And by "critiques" I mean that the good things and bad things are discussed.

Lots of food for thought in this set of articles.

+1
Have read the whole series. A little cocky but a wealth of information and effectively lowers the 4%WR to 3.5% in many examples.
 
+1
Have read the whole series. A little cocky but a wealth of information and effectively lowers the 4%WR to 3.5% in many examples.

Yes, excellent series...The author is now ER'd and on his long travel around the world plan.
 
+1
Have read the whole series. A little cocky but a wealth of information and effectively lowers the 4%WR to 3.5% in many examples.

Yes, for examples longer than 30 years, which you would probably expect. The Trinity Study results are confirmed in his calculations on page 4 of the combined paper.
 
Yes, for examples longer than 30 years, which you would probably expect. The Trinity Study results are confirmed in his calculations on page 4 of the combined paper.

Agree. Should have been more specific. Many folks on this site will indeed have longer than a 30 year retirement.
 
I assume PV of SS is added to total wealth in order to calculate how much of income is from guaranteed sources. I am reading left column is fixed versus discretionary. As fixed expenses only make up a third of my planned total expenses I am figuring somewhere between 25 and 50% on left column. Again, I am adding PV of SS to total resources. Under these assumptions, this table looks pretty good even with the uncertainty on how they calculated the percentages.

Marc

PS No idea why this would be considered a bad time to retire. Yes, sequence of returns can be scary but every year you retire and don't have immediate multiple negative years you are getting rid of a number of "bad" Monte Carlo runs.
 

Latest posts

Back
Top Bottom