marko
Give me a museum and I'll fill it. (Picasso) Give me a forum ...
- Joined
- Mar 16, 2011
- Messages
- 8,427
Just as when trying to play golf, whenever I play with numbers, it often doesn't end well.
I've been playing with numbers again. Hoping some of you can help me interpret what I'm seeing.
Like most of you, I track my annual portfolio return. I use my own spreadsheet and compare it with M* and they closely corroborate.
But as a 'never touch the principle' guy, what I'm really interested in is my 'net' return, which is my return that includes my gains/losses as well as my withdrawals. In short, I'm trying to gauge the portfolio's progress despite my withdrawals.
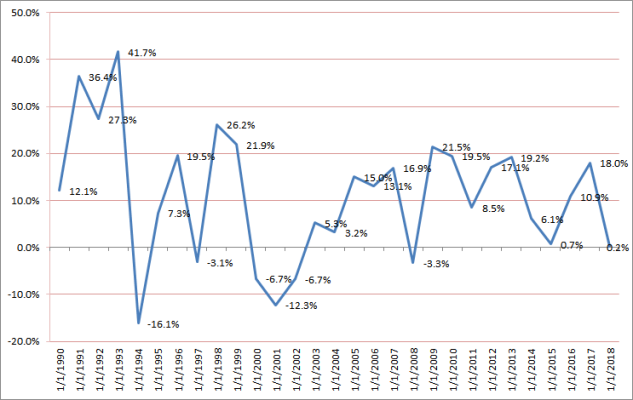
What I've done is go back to my January 1 start balances for each year since 2006. I figure that each Jan 1 balance will include all my gains/losses and withdrawals from the previous year.
What I found is that since my start (2006), my average annual gain is ~3.5% which would include gains and withdrawals. I also found that I doubled my portfolio in 11 years, which included the 2008 debacle.
I've had only two negative years --2008 and 2018-- but since my overall gain is 3.5%, I believe this tells me that despite my withdrawals and occasional market loses, I'm still in good shape considering everything.
Am I missing something or does this make sense? Can I assume that as long as my 2006 to present stays positive that I'm moving in the right direction? Should I be looking at a shorter time frame than starting at 2006?
Note that 2018 really skewed the numbers; not only was it a bad year but we also withdrew a heck of a lot more than usual for a renovation project. If I take out '18 my net return since '06 is more like 7%...but I know you can't do that.
I've demonstrated here time and again that I have a true blind spot when it comes to math (pls be kind) so any insight appreciated.
I've been playing with numbers again. Hoping some of you can help me interpret what I'm seeing.
Like most of you, I track my annual portfolio return. I use my own spreadsheet and compare it with M* and they closely corroborate.
But as a 'never touch the principle' guy, what I'm really interested in is my 'net' return, which is my return that includes my gains/losses as well as my withdrawals. In short, I'm trying to gauge the portfolio's progress despite my withdrawals.
What I've done is go back to my January 1 start balances for each year since 2006. I figure that each Jan 1 balance will include all my gains/losses and withdrawals from the previous year.
What I found is that since my start (2006), my average annual gain is ~3.5% which would include gains and withdrawals. I also found that I doubled my portfolio in 11 years, which included the 2008 debacle.
I've had only two negative years --2008 and 2018-- but since my overall gain is 3.5%, I believe this tells me that despite my withdrawals and occasional market loses, I'm still in good shape considering everything.
Am I missing something or does this make sense? Can I assume that as long as my 2006 to present stays positive that I'm moving in the right direction? Should I be looking at a shorter time frame than starting at 2006?
Note that 2018 really skewed the numbers; not only was it a bad year but we also withdrew a heck of a lot more than usual for a renovation project. If I take out '18 my net return since '06 is more like 7%...but I know you can't do that.
I've demonstrated here time and again that I have a true blind spot when it comes to math (pls be kind) so any insight appreciated.
Last edited: