Share Your Magical Spreadsheet?

SoReadyToRetire

Recycles dryer sheets
Joined
Aug 11, 2018
Messages
171
Location
Burlington
Hi--

It seems several people on here created their own spreadsheets to help them decide they were ready to retire.

Would any of you be willing to share your spreadsheets? (I mean the empty tool--not one containing all your own data, of course!)

I've used FireCalc and done some of my own calculations, but I'd love to see how we stand using some of other peoples' decision tools.

Thanks!
 
My spreadsheet has been customized to meet my needs and no effort was made to make it easily understood by others. Probably would need pages of notes for anyone else to make any sense of it.
 
Nothing magical about mine. I just kept track of all my expenses-every penny-on a spread sheet for six months to determine if I could even think about retiring. I had no idea how much I spent a month until then, although I did and still do live frugally.
Had simple headings covering each type of expense-Utilities, Home, Health, Car, Groceries, etc etc. Then I had columns for income that I expected if I was already retired, total expenses, and whether I was in positive or negative territory at the end of the month. You can customize your spread sheet anyway that reflects how you spend your money.
 
Last edited:
My spreadsheet merely consisted of rows of income streams on the vertical (Y) and amount of money remaining in each stream per year from present to age 90 on the horizontal (X). By changing the yearly gross income per year out to the end, I could determine when various streams ran out and which ones to not tap until later. Since I was shooting for $100K gross per year, the spreadsheet told me when I could retire and maintain that gross (in today's dollars). That spreadsheet was also the source of the data I fed into 'firecalc'. Tools I used included various calculators from Bankrate.com , including the 'compound interest calculator' and 'Savings withdrawal' calculator. The calculators provided by the various keepers of our money worked OK also.

I then jazzed it up with colorful charts for showing to DW. (that backfired a little because DW saw the data, and within 2 years she had early retired, causing me to work longer which was OK with her :facepalm:
 
Last edited:
The best retirement planning spreadsheet I created was a time until spreadsheet.

While I was still w*rking, I think the spreadsheet calculated the years, days, months and hours until the day I chose to say bye bye :).
 
The best retirement planning spreadsheet I created was a time until spreadsheet.

While I was still w*rking, I think the spreadsheet calculated the years, days, months and hours until the day I chose to say bye bye :).


Similarly...I kept a countdown calendar on my page-a-day paper desk calendar (remember those?). Started at 1000 workdays....and smiled every day I turned a page and watched the number drop.

omni
 
Similarly...I kept a countdown calendar on my page-a-day paper desk calendar (remember those?). Started at 1000 workdays....and smiled every day I turned a page and watched the number drop.

omni


During the very rough days, I'd refer to my countdown spreadsheet as a light at the end of the tunnel :).
 
My spreadsheet has been customized to meet my needs and no effort was made to make it easily understood by others. Probably would need pages of notes for anyone else to make any sense of it.

+1

When deciding when to retire, I was really just shooting for 25X first-year expenses, not covered by DW's and my pension. That was our "number" and we ended up exceeding it by a comfortable margin. This intentionally ignored SS, which I had never counted during the accumulation phase. This was a very simple spreadsheet exercise, although you obviously need to have a good grasp of your expenses and portfolio value.

When I was within a year of pulling the trigger, the spreadsheet started getting considerably more detailed. On the expense side, it tracks many years of actuals by 19 categories and projects all this to age 100, using a variety of assumptions and cost drivers for each category, including individual inflation rates. On the income side, it tracks and projects (by year): our 2 pensions (one COLA, one not), small amount of rental income, his-and-her SS (under various claiming strategies and with some "haircut" scenarios), and then the remaining amount to be withdrawn from investments, starting with taxable dividends, then sale of taxable shares, and ultimately RMDs, HSA, and Roth.

The spreadsheet also calculates federal taxes by year, Roth conversions, and some other what-if scenarios like a possible inheritance, downsizing the main home, sale of the rental property, and possible LTC. There's also a sheet that tracks the portfolio by holding, including AA, performance by year, yield, ER, and total net worth.

In the end, I think having a solid grasp of the concepts and assumptions is more important than the spreadsheet. The spreadsheet is just the mechanism for documenting your assumptions and helping you to understand the concepts and interrelationships. So I think this needs to be a DIY affair. More importantly, all of this data should be run through historical and Monte Carlo tools like FIRECalc and Fidelity RIP for a more real-world stress-test of your data. Home-built spreadsheets are fine for tracking data and documenting assumptions, but real-world markets can do crazy things at crazy times, so you want to get a sense of success rates and worst case scenarios, etc.
 
Last edited:
Mine definitely isn't written for reuse in mind, but I actually do a few things.
1. What are my expenses?
2. What is the NPV of future SS payments if I retired today? With and without a 25% haircut?
3. What is the size of my overall portfolio?
4. Add the amounts of 2 and 3 together. Then I use my own form of a PMT based calculation (similar to VPW from bogleheads but doesn't assume fixed stock and bond returns).
5. First check: Is the amount from the calculation in step #4 greater than my current expenses? If no, then stop here. Not ready to retire. If yes, proceed to step 6.
6. Second check that is more involved: Does a backtest that includes a retirement starting in the late 60's have withdrawals (including SS), at their lowest point, that are still greater than my expenses? If no, then I'm not ready. If yes, then financially, I'm ready, but no guarantee I'm mentally prepared.
 
The big thing is figuring out a good/accurate average annual expenses amount because that is the crux of determining when you have reached F.I. Include estimate for healthcare costs. I've used Mint (dot) com since 2011 and that has been instrumental in helping me understand my actual spending to come up with a fairly accurate, sustainable spending amount.

Once you have that number, divide by the yearly withdrawal rate you intend and that will give you the total nest egg amount you need to sustain that amount of spending each year for about 30 yrs.

Adjust upwards if you want to ensure you have more cushion in case of unexpected expenses.

Basic Examples:

$40K/year expenses / 4% withdrawal rate = $1,000,000 total needed to cover $40K per year expenses, assuming a withdrawal rate of 4%/per year in year 1 and adjusted for inflation in later years. This also assumes you will maintain an equity allocation of at least 40% over those years.

$60K/year expenses / 3% withdrawal rate = $2,000,000 total nest egg needed to cover $60K/year expenses and withdrawing 3% from the nest egg per year, starting year 1 and then adjusting for inflation in subsequent years.
 
Last edited:
My spreadsheet is set up as follows
1. list of assets
2. list of liabilities
3. current net worth
4. current annual retirement contributions
5. current salaries
6. defined-benefit projections
7. investment-projections

So, basically, the top half is what I currently have and am saving, and is pretty self-explanatory. The bottom is a wish list for the future. I have a few different scenarios based on how much I'm currently saving, how much I will in the future, and if I add additional contributions. Here are some screen shots of this:

spreadsheet1-X2.png


spreadsheet2-X2.png
 
Oi.

A few tabs,
1. Budget/BalanceSheet
2. Daily Balance and benchmarks
3. FireCalc (my own version)
4. Progress showing some graphs countdowns etc.
5, 6, 7 etc. SSA, Pension Calcs, Mortgage Amortization, Earnings history

I check my models against FireCalc success rate to see how much I vary, Either way, i know what I need to do to make it to my goal, it 'aint gonna be easy, will involve some sacrifices and hopefully a little luck.

I haven't added many new "features" or "bug fixes" lately so this tells me its fairly future proof and stable.

I like running what-ifs on things like 1. Return% 2. Early debt payoff 3. SWR% 4. Roth Conversions

My advice...start small, with a budget...mine includes are FICA and all the calculations from our W2 paychecks etc...
 
Oi.

A few tabs,
1. Budget/BalanceSheet
2. Daily Balance and benchmarks
3. FireCalc (my own version)
4. Progress showing some graphs countdowns etc.
5, 6, 7 etc. SSA, Pension Calcs, Mortgage Amortization, Earnings history

..

My tabs are [yearly summary (a graph comparing gross income vs expenses & taxes, projected)]; [Income (from present to 90 YO]; [survivor (what DW would get )]; Investment allocation (pie charts)]; [Expenses (current & projected)]; [PIA calculations (since SS only calculates if you are still working)]; Life Insurance payouts (to feed survivor chart)].
 
My main master spreadsheet is really customized just for us. I have fields like inflation and real interest rates set as parameters so we can model different futures scenarios. I have it set by year with columns for pension income, SS income, other income, taxes, RMDs, home value, home equity, net worth, inflation adjusted net worth, property taxes, health care costs, other expenses, mortgage payments, etc.

The mortgage payments are fixed, property taxes usually only go up 2% due to Prop 13, other expenses I have increase with inflation, one pension is inflation adjusted but with a maximum cap, so there is a lot of customization just for our situation. Also we follow a matching strategy for investments, so we know most years we will more or less be making inflation + X%.

I use the Fidelity retirement planner for a reasonableness check on my numbers. Their results come pretty close, though my spreadsheet is even more conservative. There's not good odds of us getting tech jobs at age 80, so we'd rather plan to have extra left at "end of plan" time than not enough.
 
Last edited:
Same here - I developed ours over the course of a couple of years, and didn't do it with re-use/sharing in mind..

Key things I'd recommend if you're going to build your own would include:

- A sheet (tab) for projected income and expenses, with a column for every year until you're 90 (or 100, or whatever you're comfortable assuming in terms of longevity). This is because you need to know where the funds are going to come from to live off of - whether it's passive income streams or portfolio withdrawals. My income and expenses tab has things like:

  • Salary, Bonus, RSU vesting (3 separate rows for each of us), interest, dividends, tax exempt dividends, taxable IRA/401K withdrawals, social security (one row for each), RMDs (ditto), ST & LT Cap Gain distributions, ST & LT gains from taxable investment sales, etc.
  • Expenses across major categories - "core" (housing, food, insurance, etc), HealthCare (premiums, deductibles & OOP - a row for each), taxes, vacation and "lumpy spending" - things like a new roof or other unexpected, major purchases.
  • Net income (obviously, income less expenses)
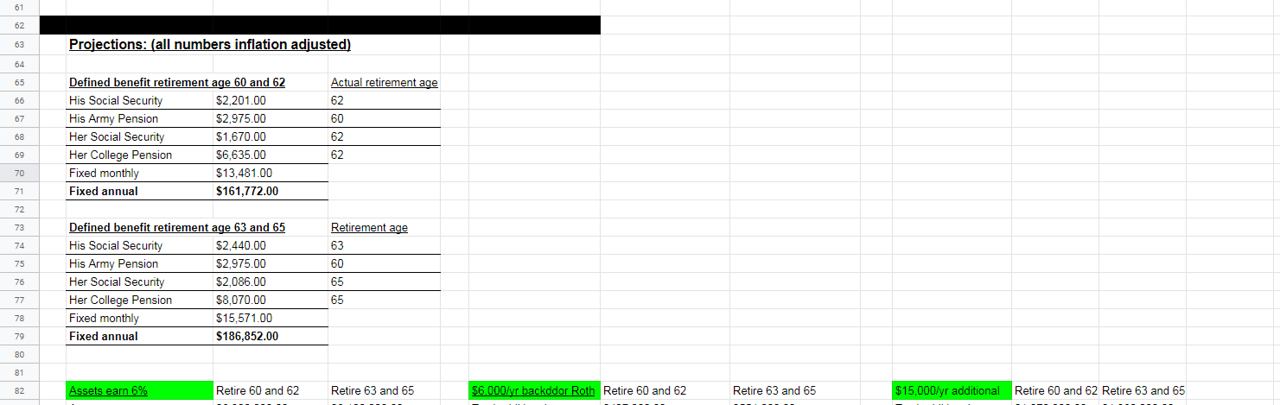
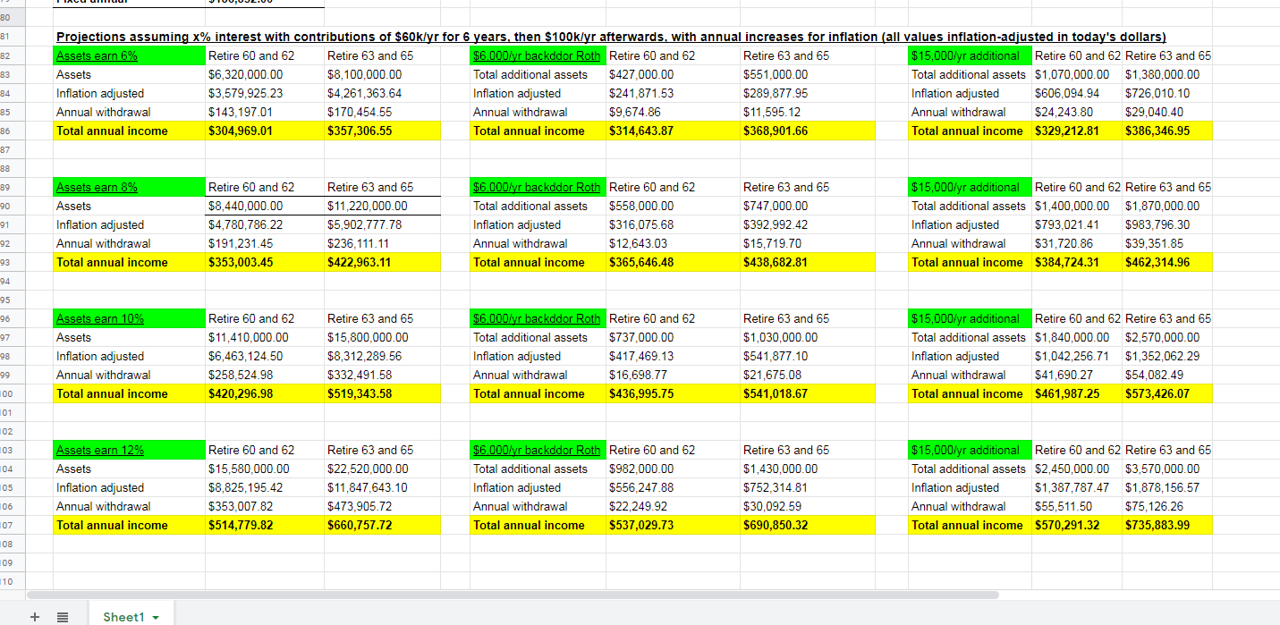
- A sheet (tab) for money flow across all assets & liabilities - also by year, across your expected remaining lifetime. Mine includes very conservative return estimates, broken out by category - tax-deferred me, tax-deferred DW, taxable, cash, portfolio impact of RMDs, company stock sales, etc.

- The two tabs feed each other..for example, if I need X to cover expenses beyond expected income flow in a given year, that has to come from somewhere on the assets tab..similarly, if I have something left over (like this year, as DW is still working), it needs to go somewhere - into one or more of the accounts on the assets tab.

As others have suggested, the KEY thing is to have a very good handle on your expected expenses. We do, as I've tracked in Quicken (and other tools before that) forever. There will always be unexpected things - hence my "lumpy spend" row on the income/expense sheet. But, if you can get reasonable projections of core, healthcare, taxes and travel, you'll know what you need to cover. And then, either the income covers it - or you determine and map (column by column across years) what you're going to pull from on the assets & liabilities tab.

My sheet has a ton of other things including interest and dividend projections, stock sales, taxes, etc - and I wrote a pile of VBA code to automate much of it (eg: federal tax calculation based off income, LT Cap Gains/Qual Dividends) and more..

Hope that helps..as long as you get the key things of income/expense and assets BY YEAR (and don't forget to include inflation assumptions that increase your expenses each year), I'd say you're well on your way..
 
Last edited:
My spreadsheet is more focused on early retirement tax planning so I only go from 63 to 79... but realistically after 70 there probably are not any arrows left in the quiver. My model does include a condensed federal tax calculation. The tax brackets start with announced 2019 and then inflate each year. All amounts are nominal and include an assumption for inflation.

My rows are Year/Age. Here are my columns:

Year
Age
Int
Div
Pension
Spending
tIRA withdrawals
Std Dedn
SS – DW
SS – Self
TI Subtotal
Roth conv
RMD factor
RMD
TI
Ordinary Income
Pref income
Effective federal tax rate
10% bracket
12% bracket
22% bracket
Ordinary tax
Div/CG Tax
Federal tax
Taxable acct balance
Tax basis
tIRA balance
Roth balances
Total
 
Last edited:
My magical spreadsheet while still working was pretty basic (naive, really). It was all about calculating when I’d reach the “magic number”. I’d read many articles that said to plan to replace 70-80% of your working income, adjusted annually for inflation, to maintain your current lifestyle in retirement. I decided to use 85%, so that was my target income.

The HR people provided accurate numbers for expected pension so that provided a base. The calculation involved how/where the difference between the target and base would come from. That was where retirement investments came in along with other (e.g., self-employment) sources.

The “magic number” was calculated using assumptions about growth rates and at least gave me a concrete number to shoot for. Having that number really helped understand that ER could (and did) happen.

That magic number spreadsheet is long abandoned and I have a much more extensive one post-retirement that’s grown more complex over time. It’s still income-focused because I use Quicken for expenses, budgeting and so on.
 
FireCalc and, for me even better, Fidelity Retirement Planner were way better than anything I would have been able to create through a spreadsheet. I had people that worked for me over the years that built massive, complex spreadsheets and I truly admired their abilities, but make one myself? Let’s just say I was good at delegating.

I did however make some crude spreadsheets just to help confirm my understanding of the online tools. Sort of a check and a reasonableness test.

In the end, as has been said, I found that truly understanding my spending was key to becoming comfortable with retiring. I seemed easier to comprehend the potential income and longevity of my investments but expenses needed more. After understanding basic spending, the tricky numbers were (are) healthcare and taxes, which includes RMD’s.
 
Basic Examples:

$40K/year expenses / 4% withdrawal rate = $1,000,000 total needed to cover $40K per year expenses, assuming a withdrawal rate of 4%/per year in year 1 and adjusted for inflation in later years. This also assumes you will maintain an equity allocation of at least 40% over those years.

$60K/year expenses / 3% withdrawal rate = $2,000,000 total nest egg needed to cover $60K/year expenses and withdrawing 3% from the nest egg per year, starting year 1 and then adjusting for inflation in subsequent years.

I notice that the $60k/year example does not include the phrase concluding the $40k/year example of "this assumes you will maintain an equity allocation..." Is this purposeful and important?

I mention this because comparing the two examples, the withdrawal rate is reduced 25% from the 40k to 60k examples (4% down to 3%), while the amount taken out is increased 50%, but the "total nest egg" for $60k/year is 100% higher than for $40k/year.

Now, $40k/year for 30 years = $1.2M, and $60k/year for 30 years is only $1.8M, so I'm trying to nail down why (a) $1M today is deemed enough for the $40k example, but (b) only 3% can be taken out in the second one. I have an "bad feel about this" (thank you Mr. Solo) that one of the first responses will result in a "slap the forehead" moment, but I'm willing to take that risk! :)

Thanks,

Stephen
 
My spreadsheet has been customized to meet my needs and no effort was made to make it easily understood by others. Probably would need pages of notes for anyone else to make any sense of it.
Same here. What ever spreadsheet you use make sure it has inflation adjustments & SS cost of living adjustments (should be about 1% less than inflation). :rant:

HOWEVER, then I figured the best ever and easiest way to figure when you have enough: When your investment income (plus SS if >65) consistently matches your current income you can retire. Wish I figured that out years ago; I'm SO done with spreadsheets.
 
Quicken has far more capabilities than I could ever dream of creating in Excel. Tracking your expenses gets you on first base,, and Quicken has helped me do this for over a. decade.
 
In 2014 I put together what I called drawdown spreadsheet. It included all the usual inputs and outputs. It also had an option to switch between SSA options at the time. I concluded that I had little room for fun. In 2015 I went FT, and will probably build drawdown 2 dot 0 at end of 2019.

To build the S/S I searched internet and had an adviser report to guide me. I think i-orp or flexible retirement planner would give you something to start with.
 
Ours started simple and has gotten ridiculously complex over the years.
tabs include both retirement and life things

stocks options (place for daily update of all individual stock,option, mutual funds holdings)
quick and dirty (place for recording all daily changes in values and predicting 3 month trends)
yearly dance classes credits used and available
net worth
net worth by ira catagories
roth conversion plans
little book (specific type of investing)
ira contributions by year
ira values per net worth values
estimated taxes 2019
goals/to do list
ira withdrawal
preferred stock
bonds/cd/zeros
real estate
annuity income
annual costs
social security income
retirement income
dashboard
annuity2
muchello (lichello volatility engine using mutual funds and cash)
lichello (rebalancing between stock and cash originally designed for mutual funds)
bond values estimated
Goals
DJU (very old, links mostly broken but retained just to not bother other tab areas)
financials (formal accounting never completed)
options
1-2-3 (red light green light as to should I be in or out of stocks use interest rate changes, SP 500 pe ratio (17 key value),market trend up or down
financial statement
rule of 72
capital accumulation
cost per 100
income
28 laws (from a self help book physical environment, well being, money, relationships, home/comfort, car/vehicle/safety, energy/vitality, opportunity/space/time
retire income (old with mostly broken links)
30 yr treasury yields (graph annually from 1977)
wedding budget
annuity
r-multiples
bond summary chart
probability analysis (probability of one spouse alive or alive alone at certain ages
pr2014 Mortality tables
retirement state rankings
financial planning

Part of the problem is you start drawing data from one area to another and then modify one area and it affects others. Each of us likely gets better at spreadsheets over the years and has old codes left here and there or broken links.

I embed a lot of financial information near crucial calculations.

One function that have been EXTREMELY useful is VLOOKUP()
I have monthly dates in left column (2019_06_01 as example) and can find that value by the date today minus the days of the month today.
 
Back
Top Bottom