4% rule failures?

Be aware that this 'comfort' can be terribly misleading as it omits the one of the "Big Three" portfolio killers - volatility. (Inflation and overspending are the other two...)

I would say that Firecalc is a good tool and no one tool can identify all the risks.
For one thing it is very USA focused and the USA has not been rocked like much of the world in the past 100 years - think USSR dissolving, WWI, WWII, China's Cultural revolution, Argentina's economic problems etc - none too good for retirement.

If you think the USA is an empire in decline that aspect and affect is not in Firecalc either.

You have to try to assess all the risks and the benefits of retirement. When I retired 4.5 years ago I knew that there were going to be bad times ahead but I didn't know the severity of what just happened. The only change I would have made would be not buying a house.

I don't think we are out of the woods yet - maybe another 4-8 years of volatility then another secular bull market.
 
Be aware that this 'comfort' can be terribly misleading as it omits the one of the "Big Three" portfolio killers - volatility. (Inflation and overspending are the other two...)

Yes - that's why I update it all the time. And watch it. So far I'm doing well with it. But I do pay a lot of attention to it.
 
Curious if anyone has ever heard of a real life example of someone failing in FIRE when using a reasonable safe withdrawal rate, and if so how was it realized and handled?

Very good question.

I believe that investing strategies have to change depending on economic and market trends.

FIRE does some very long term averaging, and it's really good for that. In normal times one could do very well with FIRE.

Every now and then a perfect economic storm arrives and you know you have to bet against the worst case outcome. FIRE will sell you short in those times, so you have to cut and run.

The perfect economic storm involves global politics and trade on a scale never seen before, so is not represented in past performance.

We are probably in an outlier scenario, and it takes some chutzpah to chart one's own way in these times.
 
RE:

Originally Posted by ERD50
...
Also, remember that the historical data says that a 30 year 4% WR and a diversified portfolio means that you could see your portfolio drop to less than half what it was (in buying power) and still 'succeed'. I think most would be pretty frightened by that, and might go back to work or make other adjustments if that happened.

-ERD50

I think it would depend on my age, and how big the portfolio was in relation to my basic needs.

If I was 65 and lost 50%, that would be frightening.

If I was 95 and lost 50%, not so big a deal.

Well, I've been curious about this and I think I found a way to show it a bit clearer. I entered a $1M, 30 year portfolio into FIRECALC (makes it easy to convert spending to % SWR) and found a 3.6% WR reports one failure and 3.55% reports zero failures.

Then, to get a better resolution look at where the 3.55% - 30 year portfolio would be at the five year mark, I changed the time frame to 5 years. And out of all these successes, a number of them are below (or very near) the half-way mark. So if you retired @ 60, this is reporting that you definitely could see your portfolio drop to less than half at age 65, and you would definitely succeed - with no changes to your spending along the way (based on the worst case history in FIRECALC).

It might be frightening, but the people going with the default 4% WR would see even worse over that 5 year period (and of course, 5% of those scenarios fail historically). One should be prepared for it, because that is what has happened.

-ERD50
 

Attachments

  • FireCalc-3.55% 100% success 30 years shown.png
    FireCalc-3.55% 100% success 30 years shown.png
    61.7 KB · Views: 7
  • FireCalc-3.55% 100% success 5years shown.png
    FireCalc-3.55% 100% success 5years shown.png
    28.1 KB · Views: 8
One should be prepared for it, because that is what has happened.

-ERD50
But perhaps those folks did not have God on their side, or the Bernanke put to rely on?

Ha
 
Hi ERD50, that was a good point you made about running FIRECalc to examine drawdowns. So I tried a similar approach, ran FC to get max spending with 98% success rate for 20 years (got 1 failure in 81). Then changed the spending level accordingly and the time to 5 years. Got a nice graph as you did.

Too bad FC doesn't have the option to output a chart in semilog form. Then we could more easily read off those drawdowns.
 
We've talked about it before, but there is a bit of a problem with looking at longer cycles in FIRECALC. A 50 year period cannot include any data from 1960 onward. So you 'escape' the very bad inflationary period of the 80's in the analysis. So I'd be careful with that assumption of safety.

-ERD50
Firecalc uses data till 2009, I think.

You will not get any 50 year period starting after 1960, but the data in that time frame will be included in 50 year periods beginning before then.
 
Firecalc uses data till 2009, I think.

You will not get any 50 year period starting after 1960, but the data in that time frame will be included in 50 year periods beginning before then.

Yes, that's true and I should have said it that way. It might be largely a moot point though in practice, since the bad periods at the start of a retirement are generally the causes of failures. So the 80's inflation cycle would hit about ten years into a 40 year scenario. We'd have to look more closely to see if those are among the first failures or not.

-ERD50
 
Well, I've been curious about this and I think I found a way to show it a bit clearer. I entered a $1M, 30 year portfolio into FIRECALC (makes it easy to convert spending to % SWR) and found a 3.6% WR reports one failure and 3.55% reports zero failures.

Then, to get a better resolution look at where the 3.55% - 30 year portfolio would be at the five year mark, I changed the time frame to 5 years. And out of all these successes, a number of them are below (or very near) the half-way mark. So if you retired @ 60, this is reporting that you definitely could see your portfolio drop to less than half at age 65, and you would definitely succeed - with no changes to your spending along the way (based on the worst case history in FIRECALC).

It might be frightening, but the people going with the default 4% WR would see even worse over that 5 year period (and of course, 5% of those scenarios fail historically). One should be prepared for it, because that is what has happened.

-ERD50

Nicely done ERD50.

Based on reading zillions of posts here on the forum, it seems like there is a misunderstanding by some folks regarding "stability" of portfolio value over time and their ability to control it. FireCalc 100% success outcomes DO NOT mean your portfolio won't have wild dips and dives over your retirement and won't end with only a nickle left when you croak (on schedule!) in 30 years. And I think many over estimate the impact of temporary spending reductions on adding to stability.

And earlier version of FireCalc had graphical outputs which helped understanding this. I especially liked the graph which showed ending values by starting year. That's where I first noticed that the so-called Great Depression years were not the toughest starting years for a FIRE portfolio.
 
One somewhat misleading sentence in the summary report for FIRECalc states (numbers with x's are my simplification of a dummy FIRECalc run) :
The lowest and highest portfolio balance throughout your retirement was $1,xxx,xxx to $7,xxx,xxx , with an average of $3,xxx,xxx .
Actually this only refers to the end portfolio values and not to intermediate values.

To see this you can run it with 100% success rate and then rerun after checking the box in the "investigate" tab that says "Leave some money in the portfolio for my estate". Then put in something like $800,000. The portfolio will now have some failures at intermediate years before the end of the sequence.
 
Are there people on the forum who've been doing a 4% (or around that value) for any length of time?

Say 10 years or more?

How did their actual portfolio compare to the FC output?

Or if not on the forum, anywhere?
 
It is interesting that after a few days, no one has answered to the question posed above.

Then, to get a better resolution look at where the 3.55% - 30 year portfolio would be at the five year mark, I changed the time frame to 5 years. And out of all these successes, a number of them are below (or very near) the half-way mark. So if you retired @ 60, this is reporting that you definitely could see your portfolio drop to less than half at age 65, and you would definitely succeed - with no changes to your spending along the way (based on the worst case history in FIRECALC).

Yes, you could see your portfolio losing more than half its initial value, and yet if you hang on, you may survive. Yes, if we trust that the future will be like the past. That will take a leap of faith that one simply will find difficult to take. Most of us would try to do something about it, like cutting back on the withdrawal rate. However, that withdrawal reduction would have to be more permanent than for just a few years before it can help rebuild the portfolio.

Based on reading zillions of posts here on the forum, it seems like there is a misunderstanding by some folks regarding "stability" of portfolio value over time and their ability to control it...

... And I think many over estimate the impact of temporary spending reductions on adding to stability.
Yes, a temporary reduction would not help much. It has to be on a longer term to be effective.

Otar, in his book that is discussed in another concurrent thread, says that if your portfolio has reduced to a level such that your WR reaches 10%, even if good years follow that, history shows that the most the portfolio will last is only 19 years.

Otar provides another check to see if you retire into a string of unlucky years. If at the 4th year after retirement, if your portfolio is not higher than when you retire, the risk of it running out is getting higher.

But as many of us have asked, how do we know where we are in the stock market cycle to avoid setting off on the wrong foot to start out with? In Chapter 21, Otar suggests looking at the P/E to see if the market is overvalued or not. However, he adds that P/E ratio is just another thing to consider, and is not a fool-proof signal. To paraphrase it, a high P/E when you start your retirement is almost a sure thing you will be doomed, but a low P/E only reduces the risk and does not guarantee success.

At the end of Chapter 22, Otar makes the remark that his observations are based on the past, and "future outcomes will likely be less favorable for the retiree."

You've got to love that. "You pays your money and you takes your chances." All one can do is to increase his odds, but there is never any guarantee in life!
 
Because FIRECalc said that I would be dieing with "money out the wazoo", I cranked up the spending to see where I would get a failed cycle.

It turned out that I would have to almost double my expected spending to get one failure! But for a frugal guy like me, that is an obscene spending level. Money does buy pleasure, but for me, that level is way past the point of diminishing returns. I would be throwing money away.

And then, I remember Bernicke's spending model, which I like a lot. It tapers off one's spending as one slides deeper into geezerhood, starting at the age of 56. Egads! I am almost there at that age.

Still, I turned that model on, as it fits me, a guy with few indulgences and no expensive habits. Yep, FIRECalc says I will die with lots of money again.

I am really not sure if I can buy this. Thirty years is a long time in this fast changing world. A black swan is likely to come along and chomp us to pieces. FIRECalc cannot model anything like that.

Oh well, I guess if that happens we are all going down the tube together, so I will always have company.

Yep! If that happens, save me a camping spot in the mountains of New Mexico :D
 
Sure, I will try to reserve a slot with full hookup for you in the NM state campgrounds. But when SHTF, these spots would fill up fast and you'd better hurry on down. I don't know how long I will be able to keep them at bay.
 
However, he adds that P/E ratio is just another thing to consider, and is not a fool-proof signal. To paraphrase it, a high P/E when you start your retirement is almost a sure thing you will be doomed, but a low P/E only reduces the risk and does not guarantee success.

IMO, this quote from Otar is a meaningless statement that perhaps sounds profound but isn't. First, I would like to see examples of normal length retirements with normal asset allocation and SWR no greater than 4% failing when started say, at a a PE10 of 10 or lower.

Second, of course it is not guaranteed. What is? But unless the world is so different from the past that we will all be swimming for survival, low PE retirements as defined above will be fine. Certainly compared to a 4% SWR retirement started today.

Ha
 
Sure, I will try to reserve a slot with full hookup for you in the NM state campgrounds. But when SHTF, these spots would fill up fast and you'd better hurry on down. I don't know how long I will be able to keep them at bay.
If stuff is hitting the fan, then what would there be to hook up to?
 
IMO, this quote from Otar is a meaningless statement that perhaps sounds profound but isn't. First, I would like to see examples of normal length retirements with normal asset allocation and SWR no greater than 4% failing when started say, at a a PE10 of 10 or lower.

Second, of course it is not guaranteed. What is? But unless the world is so different from the past that we will all be swimming for survival, low PE retirements as defined above will be fine. Certainly compared to a 4% SWR retirement started today.

Ha
On page 227, Otar's chart of P/E vs. portfolio life shows that there are many data points of P/E of around 12-13 with portfolio life of less than 20 years. I assume that he was talking about a reasonable portfolio with, say 50% equities. I looked in the narration and failed to see an explicit mention of the WR to see if his computation was based on 4% or something higher.

Otar also has other discussions on how P/E affects portfolio life in Chapter 21. People who are interested should read for themselves.

Of course we all want to have a lower P/E, but given that the E being tougher to increase than the P to go down, do people want to see their portfolio being halved, in order to have the P/E down in the low teens?

There are still companies with forward P/E much lower than the S&P 500. I own some. Why are they so low? You've got to wonder if they aren't a value trap for some reasons.

Anyway, with the P/E being above 20 most of the last two decades (see S&P 500 PE Ratio Chart) , perhaps future as well as current retirees should plan on drawing only 3% or less. Should we adopt that as the new SWR?

If stuff is hitting the fan, then what would there be to hook up to?
Some of us are closer to the fan than others, and will be sprayed with stuff more. Just in case I am among the former group, meaning there are other people with income (those damn w*rkers), I think society would still be soft-hearted to provide me with some amenities.

If not, oh well, those parking spots I share with Hankster will be nice level pads, with enough clearing to stretch out our solar panels.
 
OK, this may seem sort of naive, since for some reason we all are convinced we need balanced portfolios, but....HYPOTHETICALLY, let's say
Bob figures, applying the 4% rule, that he can live comfortably on $x/yr in 2010 dollars . Let's say he's figuring on a 30 year forward horizon until death. So if x represents 4% of his current holdings he would need 30 times x to retire and to be 95% secure, right?.

Well, let's say he has a buffer in excess of that figure. Would it not be logical for him to invest his ENTIRE nest egg in TIPS? If he could lock in at any real positive return over inflation over the course of his retirement (it would have to be at least positive ENOUGH to offset taxes on gains, etc, but that's not much), he would be free from most of the concerns expressed in this forum, which imply greater risk. Am I naive in assuming this strategy would be safer in assuring his likely financial comfort in retirement than the "balanced portfolio" strategy (since over the long run it would be very difficult for him to lose, unless confronted by unusual expenses which are always a risk).?

What element am I missing here?
 
On page 227, Otar's chart of P/E vs. portfolio life shows that there are many data points of P/E of around 12-13 with portfolio life of less than 20 years. I assume that he was talking about a reasonable portfolio with, say 50% equities. I looked in the narration and failed to see an explicit mention of the WR to see if his computation was based on 4% or something higher.

Otar also has other discussions on how P/E affects portfolio life in Chapter 21. People who are interested should read for themselves.
I am not interested in a long discussion of this, as the reality is already quite clear to anyone who looks. But the chapter you cite tells that the failures he finds with PE below 12.5 are at 6% WR, 40% equities. He also states that at a WR of 4%, you should have a lifelong portfolio.
As PE he is using what he calls PE4.

A guy could get confused by looking at charts and accepting conclusions without reference to the relevant parameters.

By the way, I still would like to see what I asked for- examples of portfolio failures at 4% WR and PE 10s <=10, and normal allocations.

Ha
 
On page 227, Otar's chart of P/E vs. portfolio life shows that there are many data points of P/E of around 12-13 with portfolio life of less than 20 years. I assume that he was talking about a reasonable portfolio with, say 50% equities. I looked in the narration and failed to see an explicit mention of the WR to see if his computation was based on 4% or something higher.

...


That book is a good read. It provides some insight into some the questions we all have asked many times... and a few things I had not thought about.


The PE4 indicator would seem to be a more tangible indicator of risk than the probability of failure (i.e., probability of success) from sources like the trinity study. Years to fail... makes it more concrete.


Since the indicator is linked to the state of the market (given the cyclical nature).... it would seem to indicate the potential for stressing the portfolio. A high average PE might predict at the least, the lack of growth... at worst harbinger of a fall in the near term.

Plus it would seem to provide a rough gauge of how one might judge the safety of their WR% in years. For example... if one is 75, what WR% might the portfolio withstand given life expectancy?

But like any of these models... it just provides some insight... one needs to be prepared to make adjustments.

I have also seen the success of a nominal WR% (no CPI-U adjustment). The Trinity study shows a portfolio sustaining up to 7% if no inflation adjustment is taken.

Compliments of Bob.

Retirement Savings: Choosing a Withdrawal Rate That Is Sustainable

I believe we (DW and I) will spend more at a younger age and have a stair stepped reduction in spending that will reduce somewhat with each decade of FIRE (as we age). However, there is no way to predict the future so I am planning a level income (inflation adjusted).

We seem to be solidly in the green zone.
 
One observation.

The book did not portray the buckets approach as an optimum strategy (i.e., Asset Dedication).

The table on page 470 shows probable outcomes for a Green Zoner scenario using each management approach

All approaches but Asset Dedication had 100% chance of success till age 95.

Page 471 states that

Asset Dedication performed the poorest
The use of annuities with a portfolio seems to provide the greatest safety and highest terminal portfolio.

Many of us have SS and/or pensions which are annuities. According to these illustrations, those income streams are very important risk reducers that help sustain the portfolio (by lowering the WR%). I think all of us already knew that, but it is nice to see a study that compares the options with probable outcomes.


Since I am right in the middle of planning how to manage our portfolio and income... this is timely information.

It confirms some of my planned approach and challenges other parts of it.
 
That book is a good read. It provides some insight into some the questions we all have asked many times... and a few things I had not thought about.

Yes. And this thread discussion has also led me to ask more questions. Please see below.

... the chapter you cite tells that the failures he finds with PE below 12.5 are at 6% WR, 40% equities. As PE he is using what he calls PE4.

Thanks for pointing this out. At my previous post, I did not go back far enough from the referenced chart to see that the above was the premise for all the subsequent discussions. My fault.

He also states that at a WR of 4%, you should have a lifelong portfolio.

I see that too, but now I have other questions after thinking more about this P/E business. More on this below.

By the way, I still would like to see what I asked for- examples of portfolio failures at 4% WR and PE 10s <=10, and normal allocations.

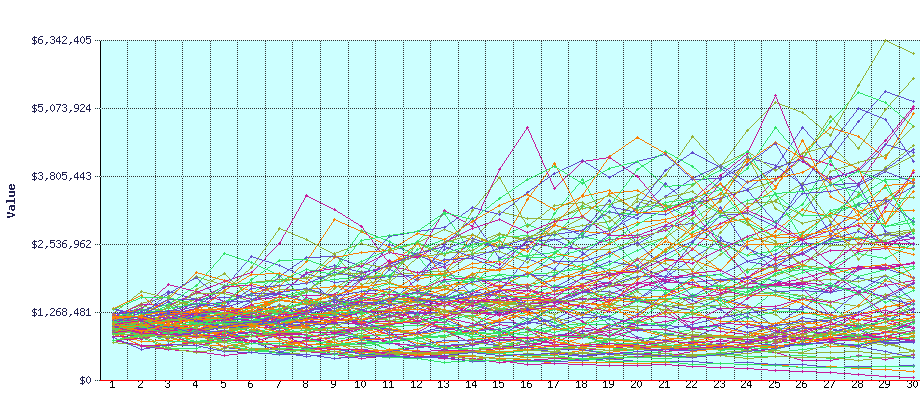
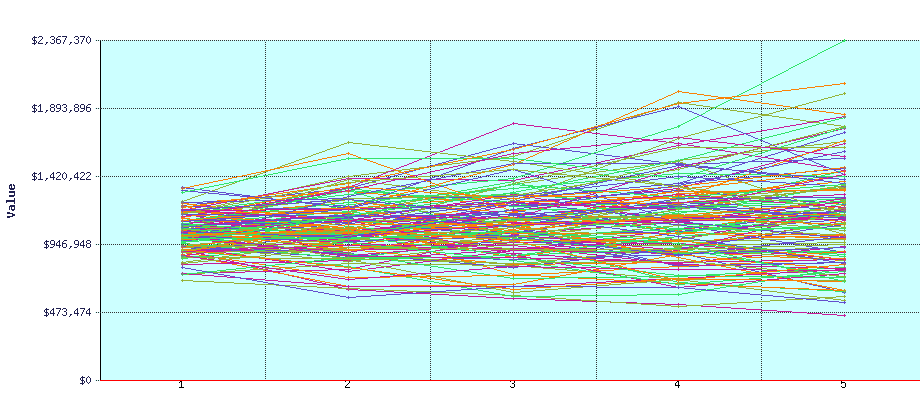
Using past histories, FIRECalc says that one would fare better with a higher stock allocation, so I use 70% equities, 4% SWR, and with everything else in default. It told me that the chance of success would be 83%. So, I have no doubt that if one imposes the PE condition like you stated, there would be no risk of failure.

But, but, but the problem we have is with the PE being as high as it has been, should we reduce the SWR to reflect the higher risk of lower total returns of the years ahead?

Let me state here again that, as I still have part-time income and not yet in the distribution phase, I have not studied this subject as thoroughly as many people here. Most of my experimentation with FIRECalc was made in the last few days. And I just read Otar's book a couple of days ago. This means that other people have given this much more consideration, and I will have much to learn from this discussion.

All this talk about P/E got me more curious, and I have more questions. Looking at the past histories of PE here going back to 1881, one can see clearly the effect of "P/E expansion" since 1990. This has been discussed much by experts in the past. Something has changed fundamentally. Is it better or worse, I don't know, but the stock market is definitely different than it was before 1980 or 1990. The phenomenon of P/E expansion was what gave me the stash that I have now. I once thought its growth was due to my brilliance, but it now makes me leery.

And speaking of the dividend yield, this chart also shows the dividend yield going back to 1881. It looks like it was averaging around 5% up to 1955, and perhaps 3.5% from 1955 to 1990. Compared to those, the S&P 500 dividend yield since 1990 looks pitiful, and is only 1.8% now.

With a high dividend yield in the past, it is no wonder then that a WR of 4% would be no sweat in the past. And for a retiree in the 1990-2010 period, the P/E expansion gave plenty of cap gains to enjoy.

By the way, I also found this chart of historical inflation interesting. A hundred years ago, there were periods of high inflation alternating with high deflation. The wild gyration in the past (1882-1950) makes our recent experience a mere molehill. Should we thank the Fed for that?

Looking ahead, what can we expect? Dividend yields to return or should we continue to look for and depend on cap gain? I recall that we have had a recent thread about 2.1% real return in the years ahead, and rereading it, I now remember that I decided then that a small motor home in the mountains of New Mexico would be my back up solution.

We seem to be solidly in the green zone.

The truth is that if I am to retire right now, we can maintain the existing lifestyle on 3%. Once we get SS at 62, we can live well on even less. In addition, I do not worry about living for more than 30 years. So, I'm set, I think.

Even though my conservative nature will not let me push the WR to the highest possible whatever that might be, the discussion of SWR leads to me learning more, and is intellectually interesting.
 
OK, this may seem sort of naive, since for some reason we all are convinced we need balanced portfolios, but....HYPOTHETICALLY, let's say
Bob figures, applying the 4% rule, that he can live comfortably on $x/yr in 2010 dollars . Let's say he's figuring on a 30 year forward horizon until death. So if x represents 4% of his current holdings he would need 30 times x to retire and to be 95% secure, right?.

Well, let's say he has a buffer in excess of that figure. Would it not be logical for him to invest his ENTIRE nest egg in TIPS? If he could lock in at any real positive return over inflation over the course of his retirement (it would have to be at least positive ENOUGH to offset taxes on gains, etc, but that's not much), he would be free from most of the concerns expressed in this forum, which imply greater risk. Am I naive in assuming this strategy would be safer in assuring his likely financial comfort in retirement than the "balanced portfolio" strategy (since over the long run it would be very difficult for him to lose, unless confronted by unusual expenses which are always a risk).?

What element am I missing here?
Sure, if Bob has a lot in excess of the Magical Figure, he can put it all in TIPS, or in bonds and live off the interest -- assuming he is living in the right part of the cycle that represents the "long run."

If Bob can count on that happening, then, that's how he should invest. If he isn't sure his life will exist only in the "long run," then rather than a 'balanced' portfolio, he should construct a portfolio that represents an asset allocation which will provide growth and safety.

-- Rita
 
Thanks for the reply, Gotadimple!

But please explain, what do you mean when you refer to the "long run" scenario? And under what conditions would a balanced portfolio be less risky than an all-TIPS portfolio, which almost guarantees Bob to beat inflation in any market, despite the scenario? The balanced portfolio is providing for likely greater gains combined with commensurate much greater risk (vs all TIPS). If greater gains are likely unnecessary (according to the 4% rule), then a balanced portfolio seems like a gamble with a small up-side but a potentially devastating down-side.

Does that make sense?
 
Back
Top Bottom