Great question! I am not confident I can answer that, but let me share what I have. First, I am indebted to big-papa for directing me to Simba's spreadsheet (updated) from Bogleheads. The spreadsheet must have been an enormous amount of work by Simba, updated by several others. A thousand thanks to all!
https://drive.google.com/file/d/0B6rEnGbxebTBOWRfMUpDOC1jbWc/view?pli=1
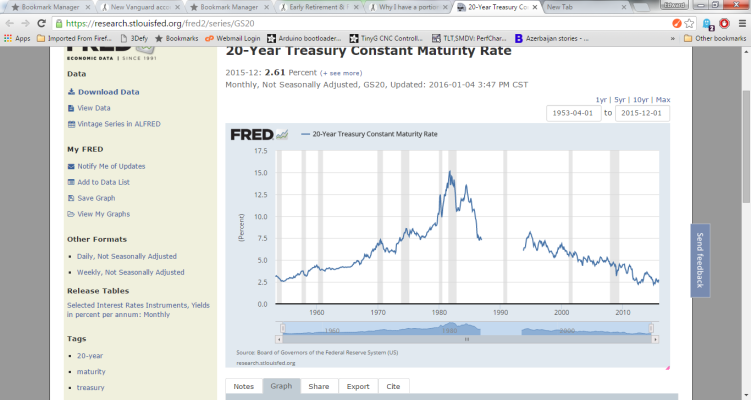
The first image is from FRED (thank you for the reference!) showing long-term (>20 years?) since 1954. Note the gap when LTB were not issued. Interest rates peaked in 1982.
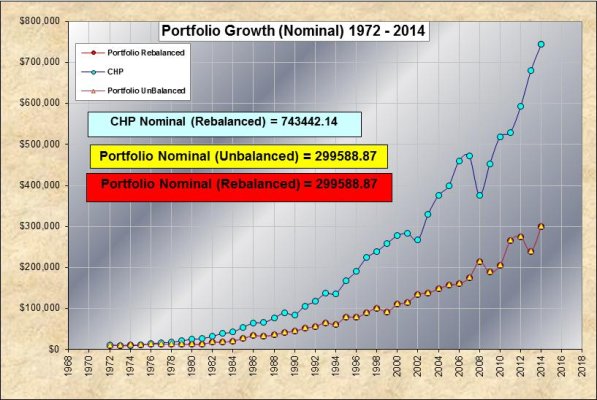
The second image is from Simba's spreadsheet for 100% LTB from 1972 to 2014. I believe this would be for a LTB fund, but I cannot confirm that. I believe this is for no withdrawals, just compounding. The blue dots are for the Coffeehouse Portfolio, for reference. (LTB<<CHP.)
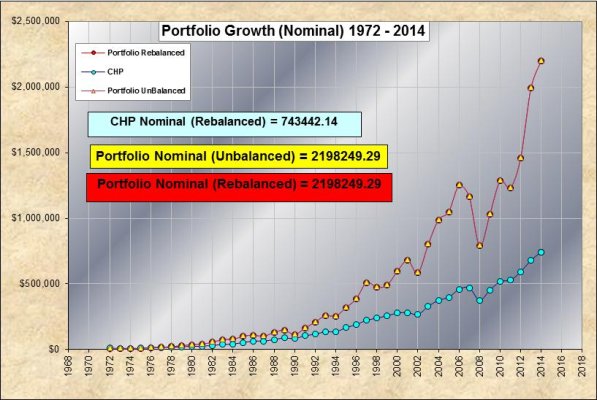
The third image is also from Simba's spreadsheet showing 100% SCV. Again, the blue dots are for the Coffeehouse Portfolio. (SCV>>CHP.)
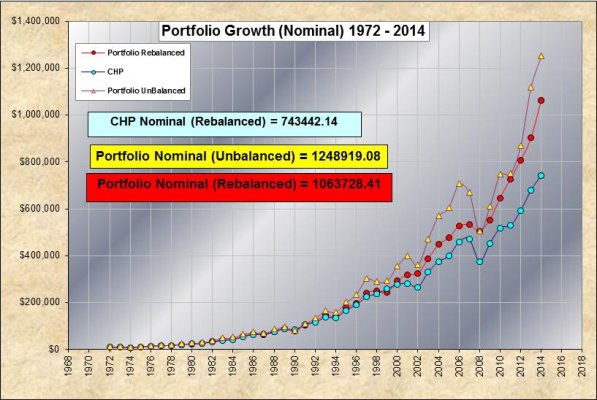
The fourth image is for a 50/50 SCV/LTB (fund?) portfolio vs CHP. The red dots are for the portfolio rebalanced; the yellow ones are for not-rebalanced (why would that be interesting? Dunno. Can't shut it off, though.) Note that the rebalanced 50/50 SCV/LTB outperforms the CHP and takes a shallower dip in 2008.
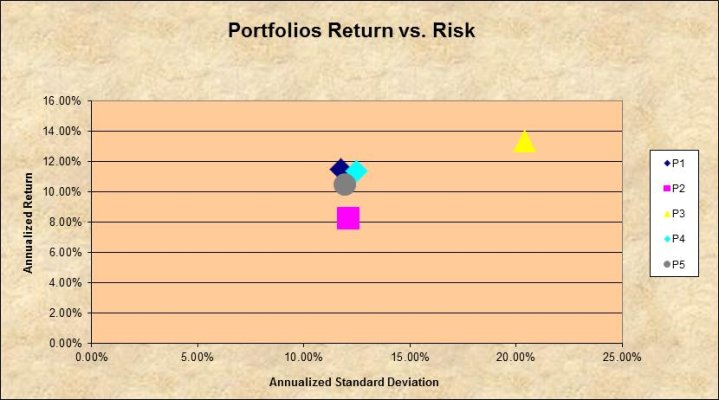
Finally, the fifth image shows 50/50 (P1, navy-blue diamond), 100% LTB (P2, purple square) and 100% SCV (P3, yellow triangle) returns vs risk, measured as annual standard deviation. (Ignore the light blue diamond and the grey circle.)
Over the 43 year period,
50/50 had a 12%+ annualized total return with 11.8% SD and outperformed the CHP,
100% LTB had a 8.9%+ annualized total return with 12.1% SD and did NOT outperform the CHP (no surprise),
and 100% SCV had a 15.3% annualized total return with 20.4% SD and outperformed the CHP.
Back to your question, it looks like the equivalent of a LTB fund weathered 1972-1984 just fine. (Not sure how they got this performance as there does not seem to have been a LTB fund that goes that far back, although I checked performance against one fund as far back as I could and they match. I have not seen any comparable data from 1954-1972.)
What are your thoughts? Anyone? Someone please poke holes in this study. It looks too good to be true: only two funds, rebalanced, outperform the CHP with less volatility.
")