Are stocks overvalued? CAPE vs 10 yr div yield

Buffett will not touch tech stocks. His record is impressive, when one considers that for decades he has shunned the tech megastocks that populate the S&P 500. He knows what he is doing, and does not have to do index.
 
Last edited:
Thanks for the link Ha.

The article says that PE10 and P/D are elevated and also:
Here is another chart, this time looking at CAPE vs CAPD. They are basically the same chart (with dividends showing even more overvaluation) and CAPE is 90th percentile and dividends 94th. Neither are good places to hang out over the next 3-10 years.
Notice he is not saying this is a short term (months) indicator. My own research gives me exactly zero confidence that PE10 will be a good short term (months in future) indicator.

My conclusion, interesting but is not actionable in its own right for the next several months. If all you care about is the >3 year outlook, you might indeed want to sell.

I could be wrong but I'm talking about data and data interpretation, not feelings.

Another reflection on this chart data. In the 1980's I was taking a newletter that charted the P/D. It started to get into elevated territory and the Faber chart shows this. The newletter back then got kind of negative on the market. Looking at the Faber P/D chart, one would have to have been out of the market since the early 1980's just using the old P/D ratio charts available back then. Would have been a very painful lesson.
 
Last edited:
Here is a pretty good WSJ article on the subject.

During the U.S. Senate confirmation hearing Thursday for Janet Yellen, the nominee to replace Ben Bernanke as head of the Federal Reserve, Sen. Mike Johanns (R., Neb.) said he thinks the Fed's loose monetary policy is pumping up the stock and real-estate markets.
"What am I missing here?" he said. "I see asset bubbles." Ms. Yellen responded, "We have to watch this very carefully, but I don't see this as an asset bubble."
Others agree. "I'm frankly a little floored that so many people are asking about a bubble," says Liz Ann Sonders, chief investment strategist at Charles Schwab, SCHW +0.74% which has more than $2 trillion in client assets. "Maybe because we've had two ferocious bubbles recently, we're more in tune with the possibility."
....
It seems like the sentiment is pricy but not a bubble on the board also.


It is worth noting what Professor, now Noble Laureate, Shiller has say about his own measurement.

The bubble skeptics include Yale University economist Robert Shiller, who won a Nobel Prize in economics in October and has a successful track record of identifying speculative excess in asset prices.
His book "Irrational Exuberance," published at the peak of the dot-com mania, accurately predicted a stock-market collapse. His 2005 update to the book then correctly identified the housing market as being in a speculative boom.
Looking at stocks today, Mr. Shiller puts it this way: "The market is somewhat high, but it's not a time when I would be writing 'Irrational Exuberance.'"
His preferred measure of valuing stocks indicates that stocks are merely expensive, rather than bubbly.
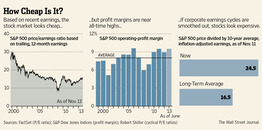
Investors frequently measure stocks' value by dividing their prices by historical or projected company earnings. To smooth out cyclical peaks and troughs in those earnings, Mr. Shiller divides the S&P 500 by the average of the last 10 years' earnings for the index's components after adjusting both for inflation.
Enlarge Image

BF-AG207_BUBBLE_D_20131115154504.jpg


By that measure, the S&P 500 has a price/earnings ratio of about 24.5, some 48% higher than the 16.5 average for U.S. stocks since 1881.
That might sound high. But before the housing bubble popped, the P/E approached 28—and as the dot-com bubble peaked, the P/E ratio reached 44.
Even though stocks aren't in a bubble, they still are high-priced, Mr. Shiller says. And many analysts and economists, including Mr. Shiller, think small investors could do well to find the places in the market where prices don't look so frothy.

The rest of the article talks about overseas bargains. I am taking a small tax loss on DGS (emerging market dividend ETF) but I'll be immediately reinvesting it in Emerging market index fund.
 
Here is a chart I occasionally update on PE10. I cumulatively rank PE10 from the 1920's. So, for instance, the rank for PE10 in Jan 1960 would only include the data a 1960's person would have seen at the time (1920 to 1960). The rank for October 2013 is 87%. The left vertical axis is PE10 and the right is the relative SP500.

The chart resets the SP500 occasionally (like at the red arrrow) to be able to see the progress versus rank. You can see that there have been long periods of high rank and still a rising market.


2005huc.jpg
 
Greenspan couldn't spot a bubble and neither could Bernanke. What's. Yellen got that they don't got? One thing is for sure. The Fed isn't providing all this liquidity so wealthy folks could retire early. Talking about P/E now is like talking about the gas mileage you get from a car in tow.
 
There are many extraneous variables for an investor to consider. The world is a complex place.
 
I am really not very interested in your reflex opinions.

I posted this only for people who like data, interestingly presented, by an intelligent man. I tend to appreciate this when others post information or novel ideas, so I try to reciprocate.

Others can certainly ignore it.

Ha

I'd take CAPE with several grains of salt, since it now includes the Great Recession valuations. It depends on where you think earnings are going; based on trailing/forward PE's I think they're fairly and low fully valued. I expect continued low increase in GDP/earnings and continued wage repression so earnings will fall to corps/executives/and thirdly investors, as we have seen the last 3 years. New Normal.

In normal times, whatever that is, the CAPE might tell us something but I don't think it's of much value right now. FWIW.
Thanks for the advice.
 
Thanks for the advice.

I should have added that while I reduced cash, which was up to 25% two years ago, to 20% now (really 15% since the rest is cash in mutual funds), I expect a 10-15% correction sometime next year, to put cash to work. And intend to harvest some gains over the next 3-4 months in anticipation.
I put trailing limit orders on NOK, Intel, MSFT, LNCO & a couple others and will harvest some gains in biotech, health, Longleaf Partners, and some other domestic funds, while averaging back into Yerp and, more slowly, in EM. Just thinking outloud the rebalance strategy for the next 1-2 years.
I was going to harvest losses in mutual bond closed ends, but they halved their losses in the last month, so it's probably not worth the trouble.
 
Back
Top Bottom