Playing around with google public data and I created this
http://www.google.com/publicdata/ex...Type&tstart=-1760292000000&tend=1269237600000
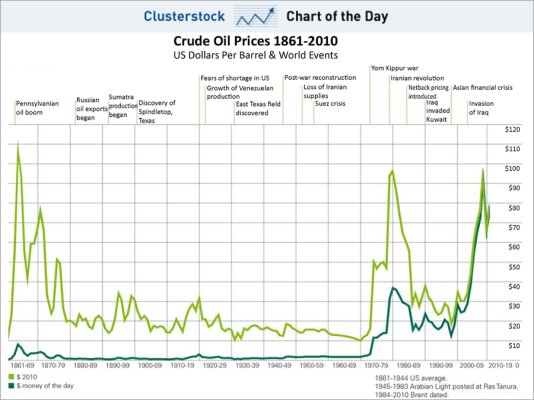
It seems that if you had invested in oil in 1914 vs just investing in something that would have just matched inflation, you would have come out way ahead.
Anyway this google public data tool is pretty cool, especially when you can upload your own data. I am a total n00b but I like it.
PS: Also pretty interesting how stable oil prices were from 1914 to 1970 (relative to post 1970.)
http://www.google.com/publicdata/ex...Type&tstart=-1760292000000&tend=1269237600000
It seems that if you had invested in oil in 1914 vs just investing in something that would have just matched inflation, you would have come out way ahead.
Anyway this google public data tool is pretty cool, especially when you can upload your own data. I am a total n00b but I like it.
PS: Also pretty interesting how stable oil prices were from 1914 to 1970 (relative to post 1970.)
Last edited: