QDCG Worksheet vs. Personal Spreadsheet

jimbohoward69

Recycles dryer sheets
Joined
Feb 25, 2007
Messages
70
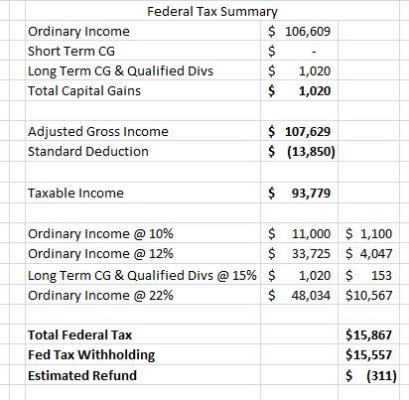
I keep my own financial planning spreadsheet that I update throughout the year. One of the tabs is for tax forecasting, so, when I realize a CG or find out what the div payout will be for a certain company, I update according. Then, at the end of the year, I download a free 1040 spreadsheet to plug in all the numbers.

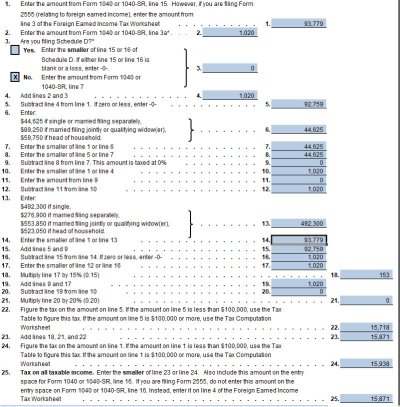
For some reason, for 2023, my total tax due on the 1040 spreadsheet doesn't match my personal spreadsheet. It's only off by a few dollars but I want to know why. My only entry on the QDCG worksheet is $1,020 in QD for ABT, and the 1040 spreadsheet says I owe $314 whereas my personal one says $311.

Maybe a rounding error? I know this isn't a first world problem, but was just wondering if I'm missing something. I've attached both...maybe someone can see something I'm not.
 

Attachments

  • Personal Spreadsheet.JPG
    Personal Spreadsheet.JPG
    44 KB · Views: 11
  • QDCG Worksheet.JPG
    QDCG Worksheet.JPG
    155.5 KB · Views: 18
Last edited:
I’ve found estimates off by 2-4 dollars just due to different implementations of the tax tables.
 
Are you entering the cents value on both forms ? If not, that could be a difference, assuming both forms use the cents value even when not displaying them.

Yes, cents value were entered in each applicable tab (W2s, 1099s, etc), which fed both my summary spreadsheet and the 1040.

I’ve found estimates off by 2-4 dollars just due to different implementations of the tax tables.

I'm thinking this may be the case. I guess as long as my estimate is within a few dollars of the 1040, that's a "win" :)
 
Maybe a rounding error? I know this isn't a first world problem, but was just wondering if I'm missing something. I've attached both...maybe someone can see something I'm not.
It's the difference between using tax formulas vs. tax tables. You can see both results in the case study spreadsheet by toggling between "Y" and "N" in cell Calculations!R80.

Using formulas gives nice clean marginal rate charts, but to reproduce results that follow form 1040 and other tax form and schedule instructions exactly, using tax tables is needed.
 
I’ve found estimates off by 2-4 dollars just due to different implementations of the tax tables.

This will be the reason.

The tax tables apply to taxable incomes up to $100K, and they are in $50 bands.

You can see that the instructions for line 22 on the right side says to use the tax table for the amount on line 5.

So you take the line 5 amount of $92,759, and in the tax tables you'll see that it's the same amount of tax ($15,718) between $92,750 and $92,780.

Since at that income level, ordinary income for single is 22%, the math/Excel approach can be off by up to 22% of $50, which is $11.

You could probably reverse engineer how they build the tax tables as the Case Study Spreadsheet clearly has done. Or you can just use the CSS or just be happy that you're within a few bucks and you understand why.
 
Back
Top Bottom