Remarkable spread in stock valuations at present

The numbers in my earlier post came from finviz.com. I am surprised to see Yahoo has different numbers. Somebody's computer did not update his numbers.

So, I went to Schwab, and here are their numbers. Their trailing P/E numbers match that of finviz.

SO 20.68 14.47
DUK 21.75 18.11
ED 3.48 17.79

Again, the first numbers are trailing P/E, while the second are forward P/E. One can expect the forward P/E's to differ slightly, because these are estimates by analysts covering the stocks, and not actual reported earnings.
From YCharts:
SO PE Ratio (TTM) 18.45
DUK PE Ratio (TTM) 21.46
ED PE Ratio (TTM) 15.23

Earnings data is revised by company, so that could account for some difference in the E.

The point I first tried to make is that the Edison P/E you quoted is very far from the actual number. Out of curiosity I looked up just the three Utilities, and found P/E to be different in each case. So it just has me wondering about measures in general, and how accurate they might be.
 
The P/E of 3.48 of Edison surely looks ridiculously wrong, yet is shared between at least finviz and Schwab. I just went to Merrill Edge, and it said 15.30. I went to TD Ameritrade, another broker that I have an account with. It said 3.48.

Something is very wrong. Should Congress pass a law mandating accurate P/E reporting by these Web sites? :)
 
Actually the FAANG stocks have been brutally beaten down over the past month. Down more than the rest of the market.

Yes. But do they deserve to be? :) Well, perhaps except for Apple.

They had such lofty P/E's, and some investors decided to cash out.
 
Yes. But do they deserve to be? :) Well, perhaps except for Apple.

They had such lofty P/E's, and some investors decided to cash out.

Right, Apple is probably the exception. Unfortunately Apple is always awarded a very low P/E compared to other tech stocks.
 
The P/E of 3.48 of Edison surely looks ridiculously wrong, yet is shared between at least finviz and Schwab. I just went to Merrill Edge, and it said 15.30. I went to TD Ameritrade, another broker that I have an account with. It said 3.48.

Something is very wrong. Should Congress pass a law mandating accurate P/E reporting by these Web sites? :)
Congress is too busy with other things. LOL.

The fastgraphs service I use calculates a Normal P/E for each stock. For example, NYSE:SO is calculated at 16.5 for 10-year period. If we agree that the P/E is 14.4 today, then SO is actually under-valued compared to the standard 15.0 GDF, and the "Normal P/E" of 16.5.

For utilities, I am supposing they are fairly valued, and not in either of the bifurcated "camps". How's that?
 
I do a modest amount of trading. In large caps I owned large cap growth (VIGAX) but switched to LC value in December as per an algorithm I use. Was up nicely but that sudden decline in growth was painful. Still finished up a very small amount on the trade.

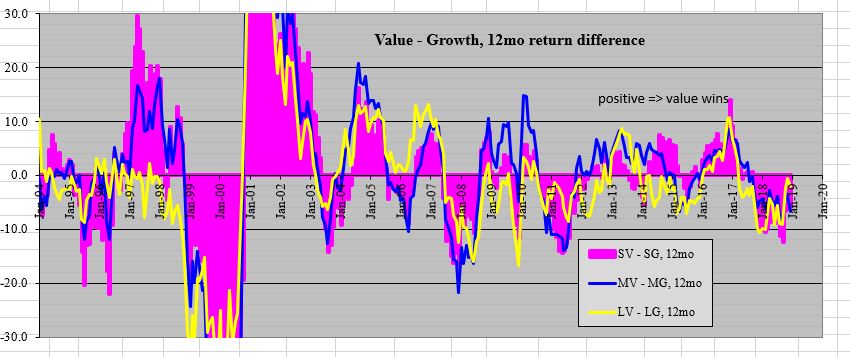
Here is a 24 year chart of value versus growth. For large caps growth is represented by VIGAX and value by VVIAX (Vanguard index funds) and is shown by the yellow line. Similar index funds are used for small caps and mid caps.

Capture.jpg


You can see the extremes we hit in the late 1990's and early 2000's when the growth bubble really popped. Since then growth and value extremes have been much more subdued.
 
... For utilities, I am supposing they are fairly valued, and not in either of the bifurcated "camps". How's that?


The P/E's of the above utility companies are slightly above that of the S&P, according to the numbers quoted, unless the numbers are wrong. I have always thought that they are value stocks, and generally have a lower P/E than that of the overall market.

Now, we can look at XLU and VPU, the two utility ETFs that I know of, to have an idea of the composite P/E of the group.

Yahoo says XLU is 8.72, while Schwab says 16.73.

For VPU, Yahoo does not know, while Schwab says 7.14.

How do we get accurate info here?
 
Right, Apple is probably the exception. Unfortunately Apple is always awarded a very low P/E compared to other tech stocks.

I don't think Apple P/E has always been this low. I never own shares of Apple to follow it closely, but recall that starting from a few years ago, the P/E dropped so low it caught my eyes. I think it may be the same time that Buffett, a value investor, started to buy some shares.

Rightly or wrongly, investors think Apple has already topped out, while they believe that Amazon and Netflix still have room to grow. I never own shares of these either. :)
 
The P/E's of the above utility companies are slightly above that of the S&P, according to the numbers quoted, unless the numbers are wrong. I have always thought that they are value stocks, and generally have a lower P/E than that of the overall market.
To be honest, for the Utilities we own (DUK and SO) I did not look at P/E when purchased. But I agree that the P/E of utilities is above S&P500. Fidelity research usually has something to make things clearer.
https://eresearch.fidelity.com/eres...s/sectors_in_market.jhtml?tab=learn&sector=55
Even there, you see different P/E estimate than other sources.
If you select the Business Cycle tab on the page, a possible explanation is shown, namely, in this part of US business cycle, Utilities are outperforming the S&P500, as they have done historically. Instead of using hard P/E numbers, I use the green/red indicators as part of a decision. You have to front-run this, though. Now isn't an optimum time to buy, obviously. The time to buy was when the sector under-performed. Of course there's more research required.

Now, we can look at XLU and VPU, the two utility ETFs that I know of, to have an idea of the composite P/E of the group.

Yahoo says XLU is 8.72, while Schwab says 16.73.

For VPU, Yahoo does not know, while Schwab says 7.14.

How do we get accurate info here?
I have more faith in the P/E numbers mentioned on the Fidelity page (for Utilities sector). There is explanation about how they reach these numbers.
P/E (Last Year GAAP Actual) 19.37
P/E (This Year's Estimate) 17.72

They sound closer to Schwab numbers. I'll have to stop there and look at the research.
 
To be honest, for the Utilities we own (DUK and SO) I did not look at P/E when purchased. But I agree that the P/E of utilities is above S&P500. Fidelity research usually has something to make things clearer.
https://eresearch.fidelity.com/eres...s/sectors_in_market.jhtml?tab=learn&sector=55
Even there, you see different P/E estimate than other sources.
If you select the Business Cycle tab on the page, a possible explanation is shown, namely, in this part of US business cycle, Utilities are outperforming the S&P500, as they have done historically...

I no longer own any individual utility stock, but have had XLU forever. Never pay much attention to it, as I devote more time looking at the more volatile stocks.

Just now look at it, and going back 1 year, 3 years, 5 years, XLU beats the S&P, both having dividend reinvested. How about that? You have to go back 10 years to see S&P beating it.

Of course, one can look at the chart and see clearly where there's fear in the market or economy, XLU leads. VPU I do not own, but tracks very close to XLU.

Should have paid more attention in order to buy low/sell high, as I am by nature a slicer-and-dicer.
 
Back
Top Bottom