Where Can I Find Data for Asset Allocations and Standard Deviations?

nico08

Recycles dryer sheets
Joined
Feb 6, 2010
Messages
429
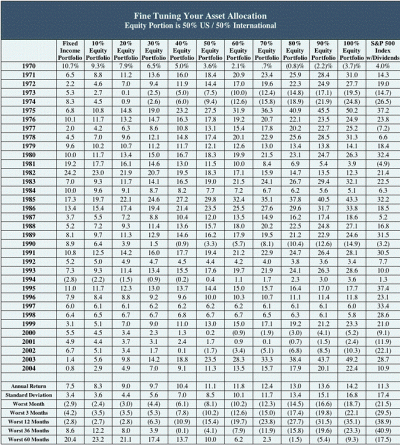
Please see the attached data chart. As you can see, the data in the chart ends in 2004. I am trying to find the same type of data, but includes the period of the Great Recession.

Do you know where I can find this type of data? I am trying to make some decisions about asset allocation, and I want to look at annual return and standard deviation based on different stock/bond allocations. And I would like for the data to be as current as possible and include 2007-2009.

Thank you.
 

Attachments

  • finetuning.gif
    finetuning.gif
    219.4 KB · Views: 60
Even more helpful would be if this chart took inflation into account and showed the real return.
 
For recent SP500 data I use as a proxy Vanguards VFINX which includes dividends. This is good for 1987 to present using the monthly data from Yahoo (Adjusted Close column): VFINX Historical Prices | Vanguard Index Trust 500 Index Stock - Yahoo! Finance

For income you will have to define what you mean here. One could use something like Vanguard Total Bond Market. Yahoo data is available for this too.
 
Thanks for the link. Do you know what they mean in the chart by "Worst Drawdown"?

I am not sure. It doesn't have a time period associated with it. It used to be explained in more depth in an article on his website about fine tuning the allocation but that seems to have been taken down. You could email him with the question at this link. They are pretty good at answering things like that.
 
Last edited:
Thanks for the link. Do you know what they mean in the chart by "Worst Drawdown"?
It usually means how much you might go down, from a given high water mark, until the port has recovered to exceed the high water mark, based on past events.

Ha
 
Last edited:
Thank you. I sent an email seeking clarification. I am curious to find out the response.
 
No problem. I hope you share what you find out.
 
...
Do you know where I can find this type of data? I am trying to make some decisions about asset allocation, and I want to look at annual return and standard deviation based on different stock/bond allocations. And I would like for the data to be as current as possible and include 2007-2009.

Thank you.
FIRECalc has spending in the mix. Looking at just a table doesn't really give you the whole picture. For instance, worst drawdown does not include spending and that can be a killer in a multi-year downturn.
 
Try Ibbotson's guide to Stocks, Bonds, Bills & Inflation. It's published yearly and has more information about the returns for various asset classes than you could shake a stick at. It also has the data for portfolios at various blends of equity & fixed income, as shown in the chart in your OP.

You might want to see if they have it at your local library. I would guess this is the source for at least some of the data underlying Simba's backtester.
 
Wow! This is a heck of a tool. I am trying to figure out how to download it.

Paul Merriman's tables are a lot simpler, though. Have you seen the one that gives US/non-US equities from 0%/100% to 100%/0%?

Have to get the Merriman data, as you mentioned.

For the b-head spreadsheet, I was logged in to Gmail, and clicked on the link. The spreadsheet opened in Google sheet with an error. I used menu to download a copy, with xls extension filled in, and was able to save that locally. I opened that with Excel. As I understand it, the file will also open in libreoffice.
 
The Portfolio Visualizer web site allows you to backtest asset allocations for multiple asset classes with data from 1972 to 2012 and shows the annual portfolio growth, standard deviation and sharpe ratio for the entered asset allocation along with inflation adjusted returns. The return data for the asset classes is available on the site as well (same as Simba’s backtester data). For a longer period of data for just stocks and bonds you can refer to Historical Returns, which has the return data for S&P 500 and 10-year bonds from 1928 to 2012.
 
Back
Top Bottom